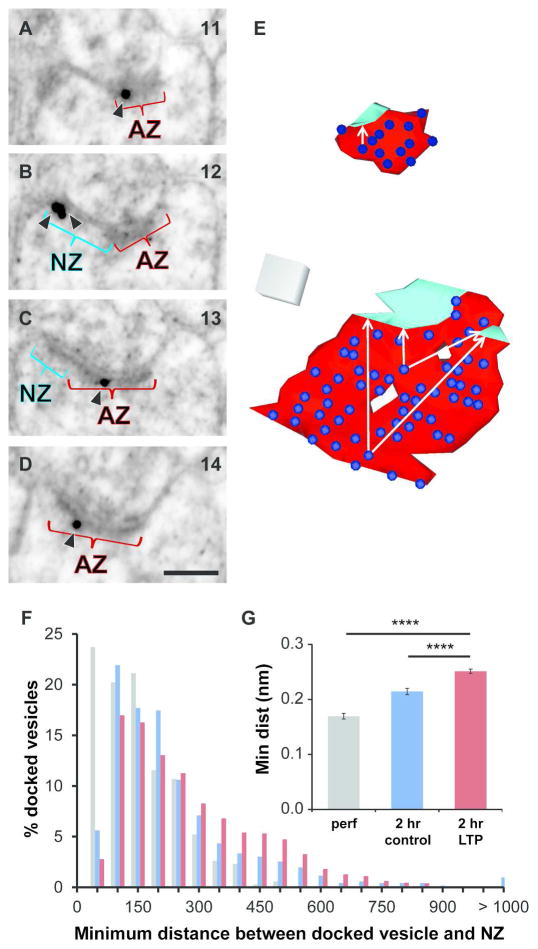
Figure 12.
Proximity of nascent zones to glutamate release sites. (A–D) Four serial sections from an unstimulated hippocampal slice illustrates gold-labeled GluA1 (arrowheads), NZ (aqua), and AZ (red). GluA1 labeling was found in the NZ (B) and in the AZ (A, C, D). Scale bar is 500 nm. Section numbers from the series are labeled in the upper right corner. (E) 3D reconstruction of an average-sized synapse with one NZ (top) and a large synapse with two NZs (bottom), both from the 2 hr LTP condition. AZ (red), NZs (aqua), and docked vesicles (blue) with white arrows illustrating example distances measured from docked vesicles to an edge of the NZs. (F) Distribution of minimum distances between each docked vesicle and NZ(s) on the same synapse in the perfusion-fixed (gray) and 2 hr control (blue) and LTP (red) conditions. (G) Mean minimum distance between docked vesicles and NZ(s) increased in the 2 hr LTP condition relative to perfusion-fixed hippocampus (hnANOVA, F(1,3811) = 60.2, p < 0.0001; post-hoc Tukey p < 0.0001****) and 2 hr control (post-hoc Tukey p < 0.0001****).

