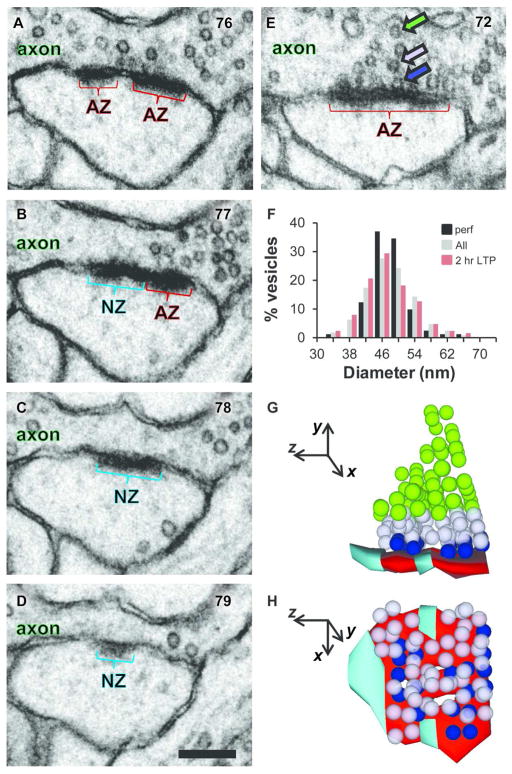
Figure 2.
Delineating nascent zones using 3DEM. (A–D) Four serial sections through a synapse from un-stimulated perfusion-fixed hippocampus show a nascent zone (NZ, aqua) at the edge of an active zone (AZ, red). Section numbers are shown in the upper right corner of each panel. (E) Another section from the same synapse demonstrates presynaptic vesicles that were categorized as docked (in contact with the presynaptic membrane, blue arrow), neighboring nondocked located < 2 vesicle diameters from the presynaptic membrane (light purple arrow), or nondocked and ≥ 2 vesicle diameters from presynaptic membrane (green arrow). (F) Distribution of vesicle diameters is presented as the percentage of vesicles across combined perfusion-fixed and slice conditions (n= 907, gray) and compared to the two potential extremes of perfusion-fixed (n= 81, black) or 2 hr LTP slices (n= 126, red). There were no significant differences in vesicle diameter between any of the series across perfusion-fixed or slice conditions or time (18 total series, one-way ANOVA, F(17,889) = 1.37, p = 0.15; vesicle numbers from the other conditions were 5 min control, 132 and LTP, 116; 30 min control, 176 and LTP, 187; and 2 hr control, 89). (G) Lateral view of the 3DEM of the synapse in A–E using same color codes. (H) Aerial view illustrates 3 separate NZs. (A–E, G, and H) Images from perfusion-fixed hippocampal area CA1 of a mature rat. Scale bar in D is 200 nm for A–E, and coordinate system in G–H has the z-direction perpendicular to the serial sections and 100 nm per arrow length.

