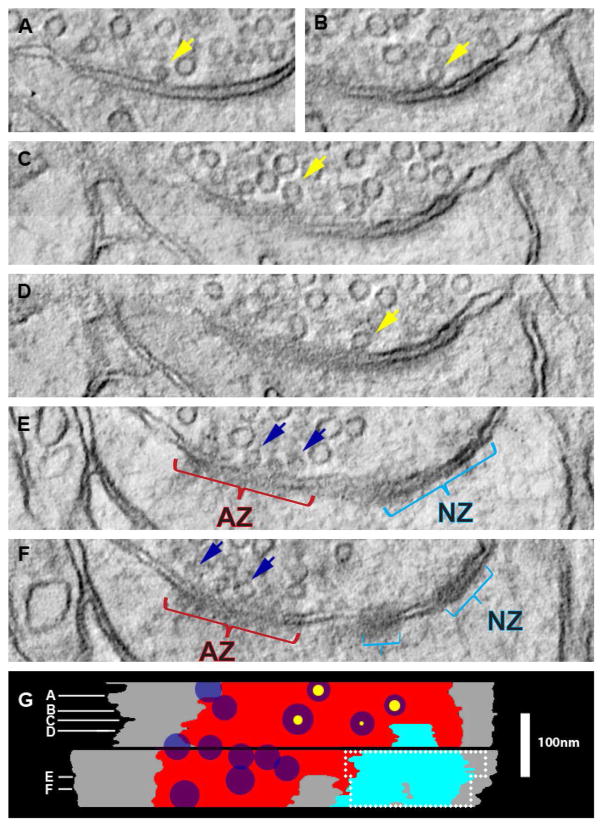
Figure 3.
Identification and measurement of nascent zones in 3DEM using virtual sections computed from transmission EM and tilt tomography. (A–F) Virtual sections from a synapse from perfusion-fixed hippocampus are shown. (A–D) Some docked vesicles had an evident pore (yellow arrows) and (E, F) others were pressed against the presynaptic plasma membrane (blue arrows) when viewed in the 2–3 nm virtual sections. (G) Stacked projection of the axon-spine interface (gray), AZ (red), and NZ (teal) that were first traced through the 2–3 nm virtual sections in RECONSTRUCT™ and then displayed orthogonal to the virtual section planes with white lines illustrating the locations of the virtual sections in (A–F). Maximum diameters of docked vesicles are illustrated as dark blue circles with scaled pores (yellow circles) circumscribed in vesicles that had them. The dashed white line bounds the region in which the same NZ was identified and measured on two of four 50 nm simulated sections for comparison. Approximately 7 nm of tissue appeared to be missing between the two ~120 nm serial sections (black band). Scale in (G) applies to (A–G).

