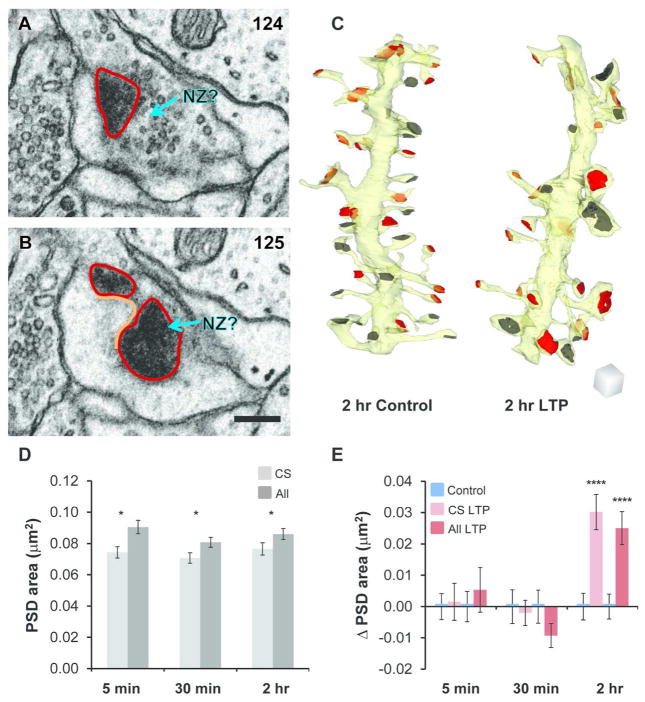
Figure 4.
For accuracy, nascent zone analyses were restricted to cross-sectioned synapses, which revealed the same effects of LTP as in the overall population of synapses. (A–B) An obliquely-sectioned synapse from perfusion-fixed hippocampus with en face PSD areas (red) shown in serial sections. These areas were added to a connector line (orange), which was multiplied by section thickness and corresponded to the portion of the synapse that passed between sections. Docked vesicles could have been obscured within the section by the en face PSD at a potential NZ (aqua arrow, NZ?). Scale bar is 200 nm. Section numbers are shown in the upper right corner of each panel. (C) 3D reconstructions of sample dendritic segments (yellow) from the 2 hr control and LTP conditions illustrating cross-sectioned PSDs that were included (red) and obliquely sectioned PSDs that were excluded (dark gray) from subsequent analyses. Scale cube is 500 nm per side. (D) When combined across control and LTP slice conditions, the average PSD area from the cross-sectioned subset of synapses (CS, light gray) was significantly less than in the overall population of synapses (All, dark gray; one-way ANOVAs, within time point, 5 min, F(1,851) = 3.94, p = 0.048*, CS n = 335, All n = 518; 30 min, F(1,1061) = 6.47, p = 0.011*, CS n = 437, All n = 626; 2 hr, F(1,989) = 5.24, p = 0.022*, CS n = 399, All n = 592). (E) Changes (Δ) in PSD area for CS synapses (pink) and All synapses (red) relative to time-matched controls were calculated by subtracting the control mean PSD area from each data point by experiment and averaging the results across condition. CS PSD area was unchanged following TBS at 5 min (hnANOVA, F(1,315) = 0.49, p = 0.49) and 30 min (hnANOVA, F(1,412) = 0.36, p = 0.55) but increased significantly at 2 hr during LTP (hnANOVA, F(1,381) = 24.7, p < 0.0001****). Similarly, All PSD area was unchanged following TBS at 5 min (hnANOVA, F(1,498) = 0.003, p = 0.95) and 30 min (hnANOVA, F(1,601) = 1.2, p = 0.27) but increased significantly at 2 hr during LTP (hnANOVA, F(1,574) = 20.5, p < 0.0001****). Data were reanalyzed from Bourne and Harris, 2011.

