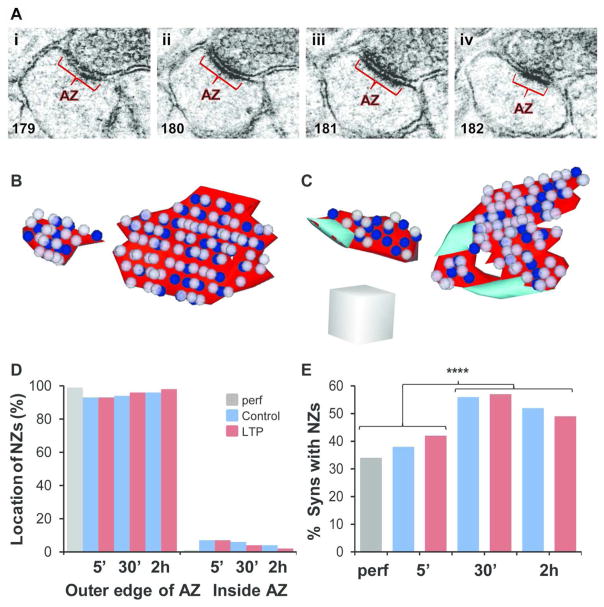
Figure 5.
Location and frequency of nascent zones. (Ai–iv) Serial EM images through an AZ (red) without an NZ from the 5 min LTP condition. Section numbers are shown in the lower left corner of each panel. (B) 3DEMs of synapses from various slice conditions as indicated, and with both small and large AZs (red) without NZs, and (C) with NZs (aqua), and docked vesicles (blue) and neighboring non-docked vesicles (light purple). Scale cube is 200 nm per side. (D) NZs were found primarily at the outer edges of AZs and were rarely surrounded by the AZ (inside). (E) The percentage of synapses that had NZs was unaffected by LTP (5 min, χ2 = 0.61, p = 0.43; 30 min, χ2 = 0.04, p = 0.84; 2 hr, χ2 = 0.23, p = 0.63). However, the combined 5 min and perfusion-fixed conditions demonstrated a smaller percentage of synapses with NZs compared to the combined 30 min and 2 hr conditions (χ2 = 28.7, p < 0.0001****).

