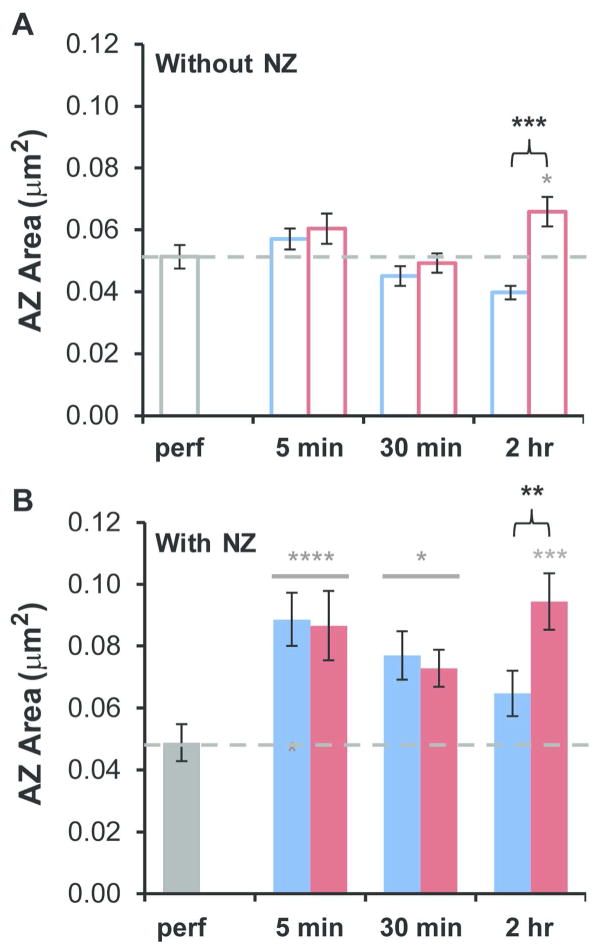
Figure 7.
Influence of the presence of nascent zones on active zone size during constitutive synaptogenesis and LTP. (A) AZ areas at synapses without NZs: Relative to perfusion fixed hippocampus (dashed gray line in each graph), AZ areas were not significantly altered in the combined 5 min (hnANOVA, F(1,257) = 2.1, p = 0.15) or 30 min (hnANOVA, F(1,238) = 0.080, p = 0.78) conditions, and increased significantly in the 2 hr LTP condition (hnANOVA, F(2,255) = 10.7, p < 0.0001; post-hoc Tukey, p = 0.042, gray*) but not in the 2 hr control condition (post-hoc Tukey, p = 0.081). Relative to time-matched controls, there was no change following TBS at 5 min (hnANOVA, F(1,183) = 0.021, p = 0.89) or 30 min (hnANOVA, F(1,164) = 0.024, p = 0.88), although by 2 hr during LTP there was a significant increase (hnANOVA, F(1,181) = 18.6, p < 0.0001, black bracket****). (B) For synapses with NZs: the AZ areas were significantly increased relative to perfusion-fixed levels for combined conditions at 5 min (hnANOVA, F(1,147) = 27.7, p < 0.0001, gray****) and 30 min (hnANOVA, F(1,259) = 6.1, p = 0.014, gray*, but in only two out of three experiments), and in the 2 hr LTP condition (hnANOVA, F(2,216) = 10.6, p < 0.001; post-hoc Tukey, p < 0.001, gray***), but not in the 2 hr control condition (post-hoc Tukey, p = 0.32). Relative to time-matched controls, there were no significant changes following TBS at 5 min (hnANOVA, F(1,111) = 1.7, p = 0.20) or 30 min (hnANOVA, F(1,223) = 0.53, p = 0.47); however, the AZs with NZs were larger by 2 hr during LTP (hnANOVA, F(1,180) = 7.9, post-hoc Tukey, p < 0.01, black bracket**).

