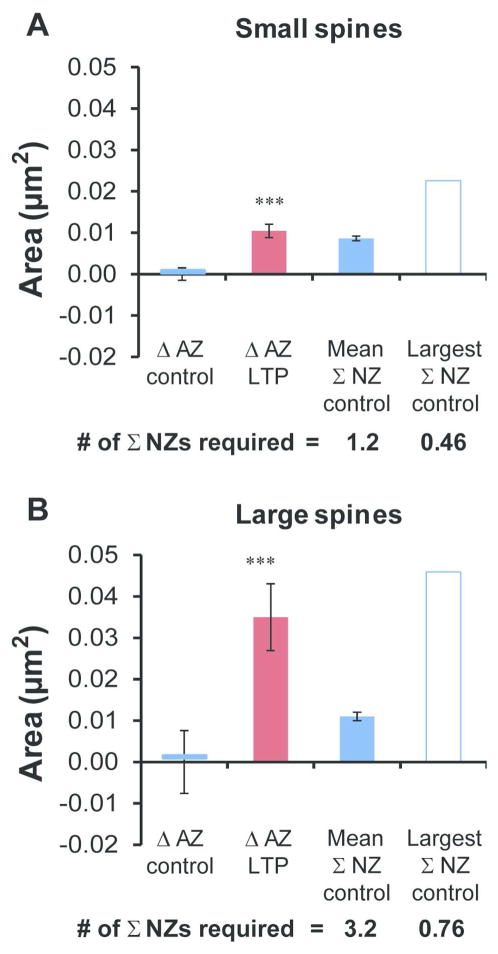
Figure 9.
Determining whether nascent zones were large enough to account for active zone growth at 2 hr during LTP. (A) AZ area increased significantly during LTP on small spines (head diameter < 0.36 μm, hnANOVA, F(1,167) = 12.5, p < 0.001***) and (B) large spines (head diameter > 0.36 μm, hnANOVA, for LTP, F(1,194) = 13.5, p < 0.001***). Changes (Δ) were calculated by subtracting the control mean AZ area from each data point by experiment and averaging the results across condition to compare changes in AZ area to summed (Σ) NZ areas. The mean and largest summed NZ areas that were found on small or large spines in the 2 hr control condition are plotted, as are the number of each required to be converted to achieve the mean AZ enlargement at 2 hr during LTP.

