
Figure 3.
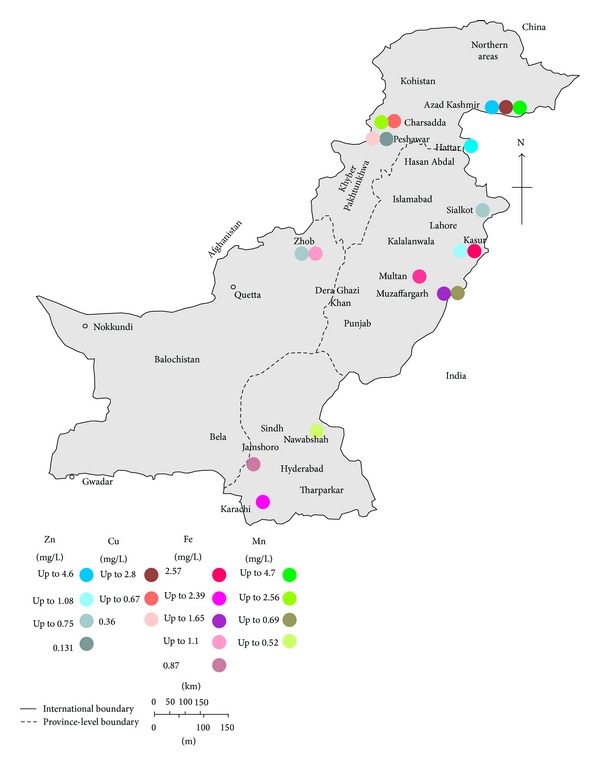
Map of Pakistan showing the Zn, Cu, Fe, and Mn concentration in ground water (mean values; where mean value is not available, the highest values are used).
Official websites use .gov
A
.gov website belongs to an official
government organization in the United States.
Secure .gov websites use HTTPS
A lock (
) or https:// means you've safely
connected to the .gov website. Share sensitive
information only on official, secure websites.
Map of Pakistan showing the Zn, Cu, Fe, and Mn concentration in ground water (mean values; where mean value is not available, the highest values are used).