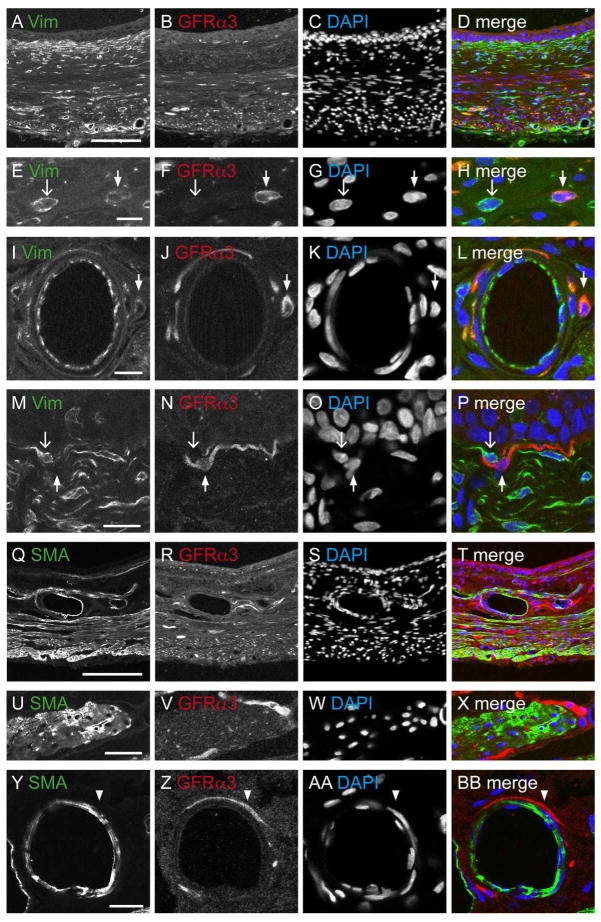
Figure 8.
Comparative distribution of vimentin- (Vim) and smooth muscle actin (SMA) with GFRα3-immunoreactivity (IR) in the bladder. All panels are confocal micrographs of immunofluorescence in bladder cryosections. DAPI labelling of nuclei was performed to indicate general cellular distribution within each tissue and to show that none of the other markers were found within the nucleus. The urothelial surface is orientated to the top in panels A–D, and M–T. A–D: Bladder base immunostained for Vim, GFRα3, and the merged image. E–H: Little co-expression occurred between Vim-IR and GFRα3-IR in cells in the detrusor. I–L:. GFRα3-IR cells associated with the vasculature were not immunoreactive for Vim. M–P: GFRα3- and Vim-IR were not co-expressed in the suburothelial tissue. In e-p, closed arrows indicate single-labeled GFRα3-IR cells and open arrows indicate single-labeled Vim-IR cells. Q–T: Bladder base comparing the distribution of SMA-, GFRα3-IR and the merged image. U–X: No co-expression of SMA- with GFRα3-IR was observed in the detrusor. Y-BB: There was no coexpression of the SMA- and GFRα3-IR associated with the vasculature; arrowheads indicate single-labeled GFRα3-IR axons. Scale bar = 200 μm in (a) also applies to (B–D, Q–T); 10 μm in (E, I) also applies to (F–H, J–L); 30 μm in (U) also applies to (V–Y); 20 μm in (Y) also applies to (BB). GFRα3, glial cell line-derived neurotrophic factor family receptor α3.

