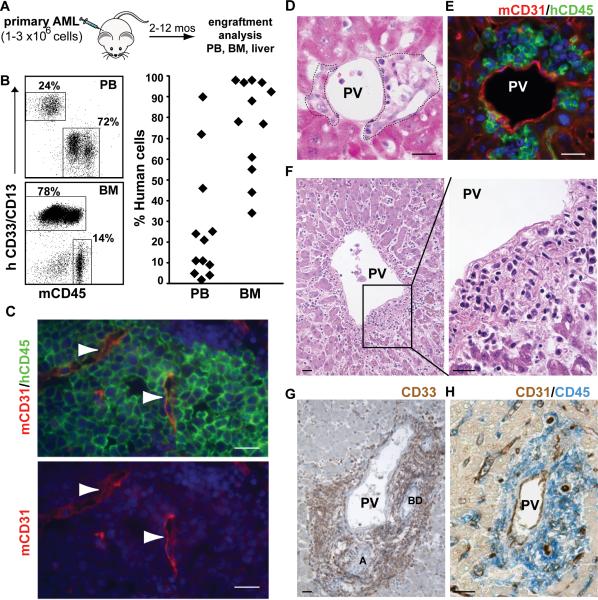
Figure 1. AML localizes to vascular endothelium in vivo.
(A) Transplantation schema. (B) Engraftment analysis of primary AML in NSG mice. Representative flow cytometry data showing the frequency of AML cells from one donor in the peripheral blood (PB) and bone marrow (BM) of xenografted animals. Each diamond in the scatter plot on the right represents an individual mouse. (C) AML cells in the bone marrow of an NSG recipient femur. Tissue sections were stained with antibodies to mouse CD31 (red), human CD45 (green). Arrowheads indicate sinusoids, which are compressed in regions with high levels of human cell engraftment. Nuclei are stained with DAPI (blue). (D) Infiltrates of primary human AML cells (outlined with dashed lines) are found immediately adjacent to portal veins (PV) in the livers of NSG recipient mice (H&E stain). (E) Human CD45+ AML cells (hCD45; green) localize next to mouse CD31+ portal vein endothelial cells (mCD31+, red). Nuclei are blue (DAPI). (F-H) Perivascular accumulation of AML cells around the portal vessels in human liver. (F) H&E stained section. (G) Extensive infiltration of CD33+ cells (brown) in a portal triad (BD: bile duct; A: artery) is shown. (H) CD45+ AML cells (blue) surround a CD31+ (brown) portal vessel (PV). Scale bars for all images are 20 microns.

