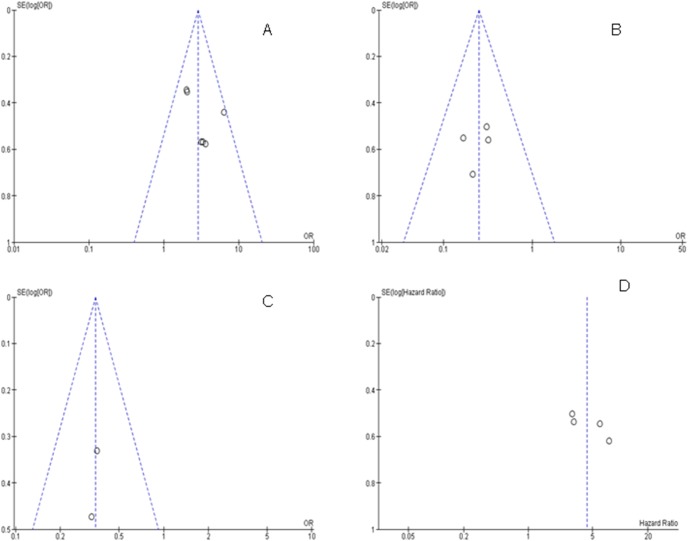
Figure 6. The funnel plots were largely symmetric suggesting there were no publication biases in the meta-analysis of RUNX3 methylation/expression and clinicopathological features as well as overall survival respectively.
The funnel plot from 6 studies comparing esophageal cancers and normal squamous mucosa (A). The funnel plot from 4 studies in determining RUNX3 hypermethylation in advanced stage (T3–T4) and early stage (T1–T2) (B). The funnel plot from 2 studies in determining RUNX3 hypermethylation in Barrett’s esophagus (BE) and esophageal adenocarcinoma (EAC) (C). The funnel plot from 4 studies in determining the relationship between RUNX3 hypermethylation and overall survival (OS) in esophageal cancer (D).

