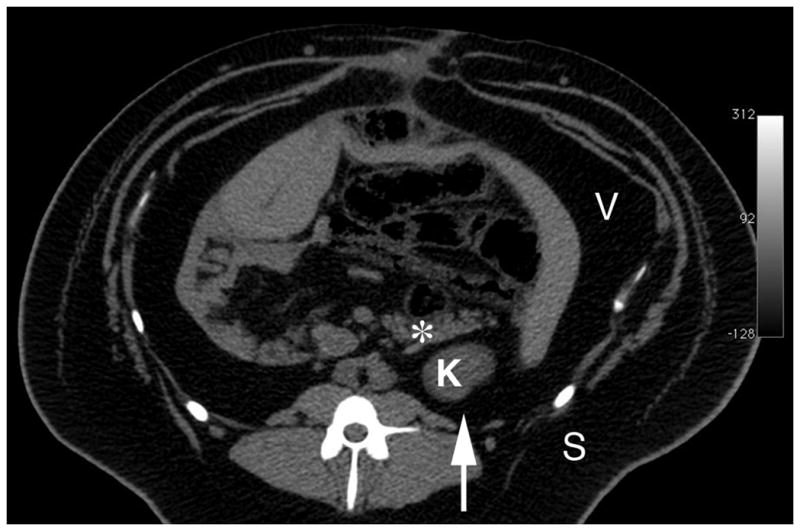
Figure 1.

Abdominal computed tomography image of an 18-month-old obese female MetS Ossabaw pig on hypercaloric atherogenic diet for 12 months. Image was acquired with a published scanning protocol.16 The extreme obesity of the pig is evident from the several cm of subcutaneous and visceral fat. * = tail of pancreas, K = upper pole of left kidney, S = subcutaneous fat, V = visceral (intra-abdominal) fat. Arrow indicates the direction of SW propagation.
