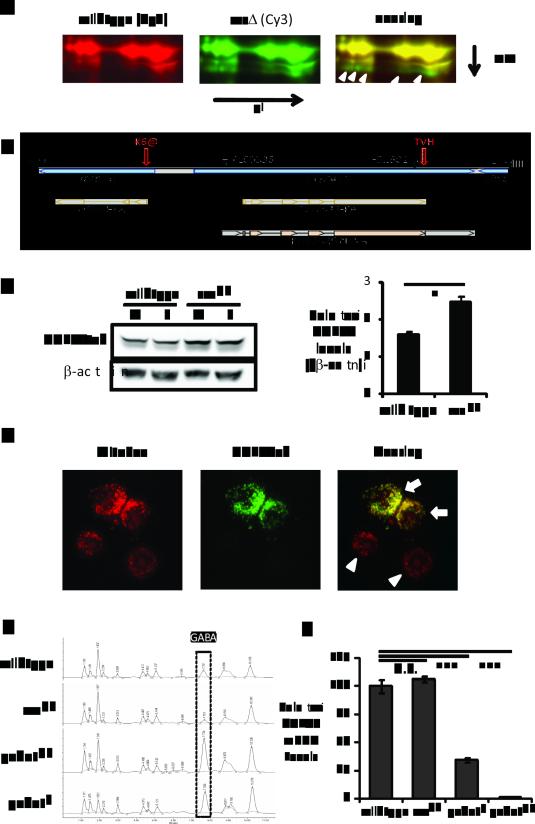
Figure 1.
GABAT is increased and GABA is decreased in sss flies. (A) 2D-DIGE of sss and wild type brain proteins. Left, proteins in wild type brains stained with Cy3. Middle, proteins in sss mutants stained with Cy5. Right, overlay image of Cy5 and Cy3 staining. Shown in the image is only a zoom-in crop of the 2D-DIGE images. The yellow color denotes similar protein levels and the green color indicates proteins increased in sss mutants. White open arrows point to the protein spots that are increased in sss and identified by mass spectrometry as CG7433 positive. (B) Schematic of the genomic DNA structure around gene CG7433 (GABAT). Shown as a bar with a black border is the 4.9 kb genomic DNA from the Bac clone BACR13N10, flanked by HpaI and HindIII sites. The shaded diagram at the bottom depicts the proteins of the CG7433 and the neighboring Tom20 gene, as well as the CG7433 cDNA clone RH42429. Closed arrowheads show the positions of the two transposon insertions, PL00338 and F01602. Indicated by the red open arrows are two modifications to the gCG7433tvh genomic construct: a thrombin-V5-His6 tandem tag (TVH) added to the C-terminus of the CG7433 open reading frame (ORF) and the mutation of the Lys6 residue of TOM20 to an amber stop codon (K6@) to disable the Tom20 gene. (C) Western blot analysis (Left) and quantitation (Right) of GABATtvh protein derived from the gGABATtvh genomic transgene. V5 staining detected higher GABATtvh protein levels in the sssp1 mutants than in wild type for both male (M) and female (F) flies. Actin staining was used as a loading control. Shown in the right chart is the quantification of the left panel, the averages of GABAT/beta-actin ratios from both male and female samples in either a wild type or sss genetic background. *: P<0.05 (Student's t-test). (D) Localization of epitope tagged Drosophila GABAT to mitochondria in S2 cells. MitoSOX marks mitochondria (left panel, red) and V5 staining (middle panel, green) denotes the expression of GABATvh. Note that the lower two cells (white arrow heads) are negative control cells exhibiting only MitoSOX staining but not V5, indicating the cells were not transfected with pIZ-GABATvh. (E) HPLC amino acid analysis to compare GABA levels from fly brains. X-axis is elution time. Y-axis is absorbance at 254 nm, indicating the level of PITC-conjugated amino acids. The boxed peaks are GABA levels from the different genotypes shown on the left. (F) Reverse transcription quantitative PCR analyzing brain GABAT mRNA levels. GABAT mRNAs are first normalized to β-actin mRNA levels then to those in wild type flies which were set as 100%. GABAT mRNA levels from sssp1 were not different from those in wild type (P=0.385), while the GABAT mRNAs from gabatf and gabatpl were significantly reduced to 34% and 1%, respectively (P<0.001, One-way ANOVA with Tukey’s test).

