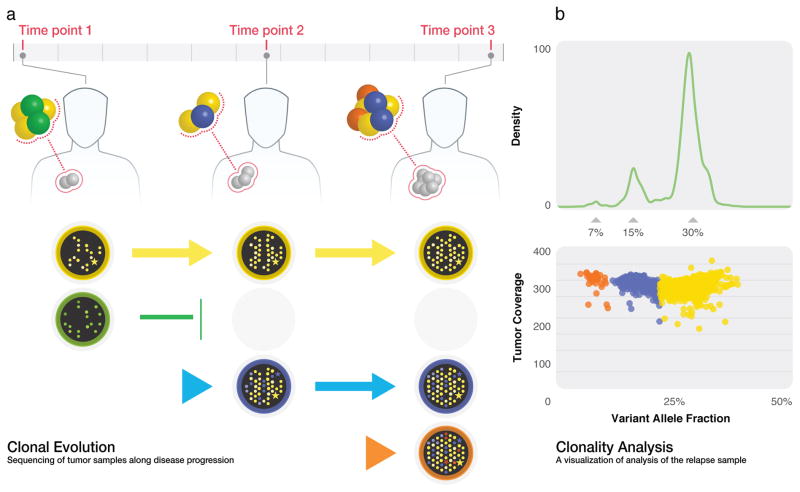
Figure 4. Conceptual example of clonal evolution model and clonality analysis.
(A) The founding clone (yellow) persists during the course of the disease. Another clone (green) present at time point 1 faces extinction before time point 2, but new subclones (blue/time point 2 and orange/time point 3) emerge during disease progression. (B) SciClone algorithm detects the three mutation clusters present at time point 3.

