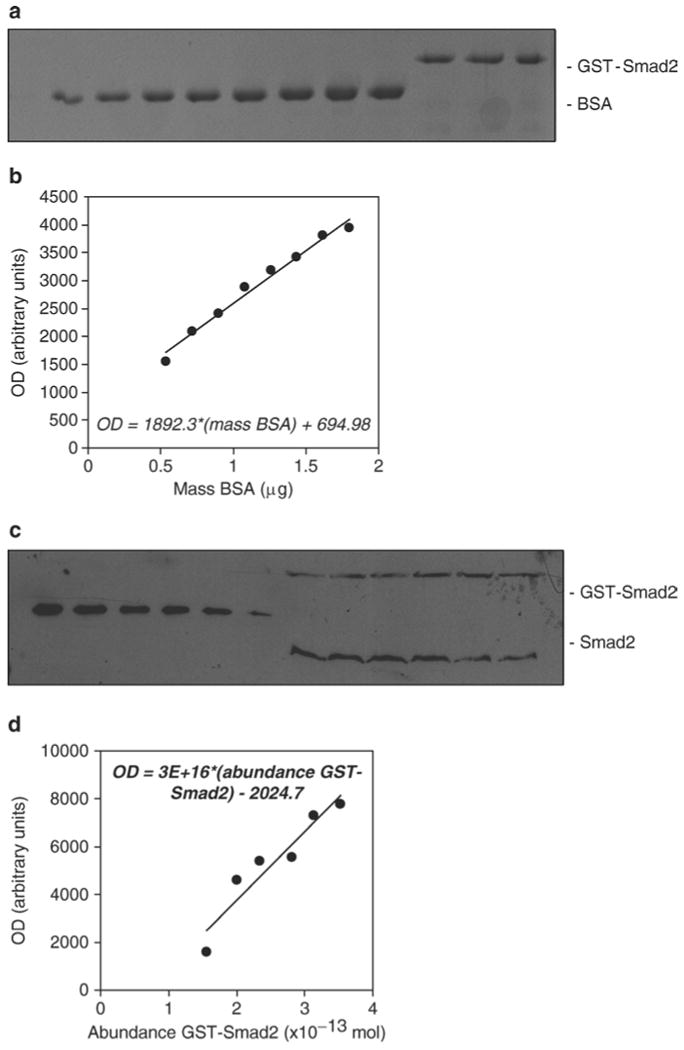
Fig. 1.

Quantification of the abundance of endogenous Smad2 molecules per cell in PE25 cells. (a) Measurement of the protein standard concentration. The recombinant GST-Smad2 protein standard was quantified using Coomassie staining with BSA standards (0.03–0.1 μg/μL in increments of 0.01 μg/muL in a loading volume of 18 μL sample + 6 μL 4× SDS buffer). Three replicates of the GST-Smad2 protein sample were run alongside the BSA standards. (b) A linear standard curve was generated using Excel's Trendline tool, from which the mass per band of each GST-Smad2 sample was interpolated. The mean mass per band was used to calculate the concentration of the stock GST-Smad2 protein standard. (c) Estimation of the number of Smad2 molecules per cell. Cells were seeded in 10 cm plates and grown to confluence, trypsinized and counted using a hemocytometer, followed by lysis with 500 μL of lysis buffer. Serial dilutions of the GST-Smad2 protein were separated by SDS-PAGE alongside the six independent lysates from untreated PE25 cells. The 12%, 15-well SDS-polyacrylamide gel was loaded with 24 μL of each sample. Proteins were subsequently transferred, immunoblotted with a Smad2-specific antibody, and detected using enhanced chemiluminescence. (d) The GST-Smad2 dilutions conferred a reasonably linear standard curve, which was fit using Excel's Trendline tool, and was then used to estimate the abundance of endogenous Smad2 molecules per band. These numbers were then divided by their respective number of cells, and the six estimates were used to calculate 95% confidence intervals for the number of Smad2 molecules per cell (we reported that 8.5–12 × 104 Smad2 molecules per cell exist in PE25 cells (14)).
