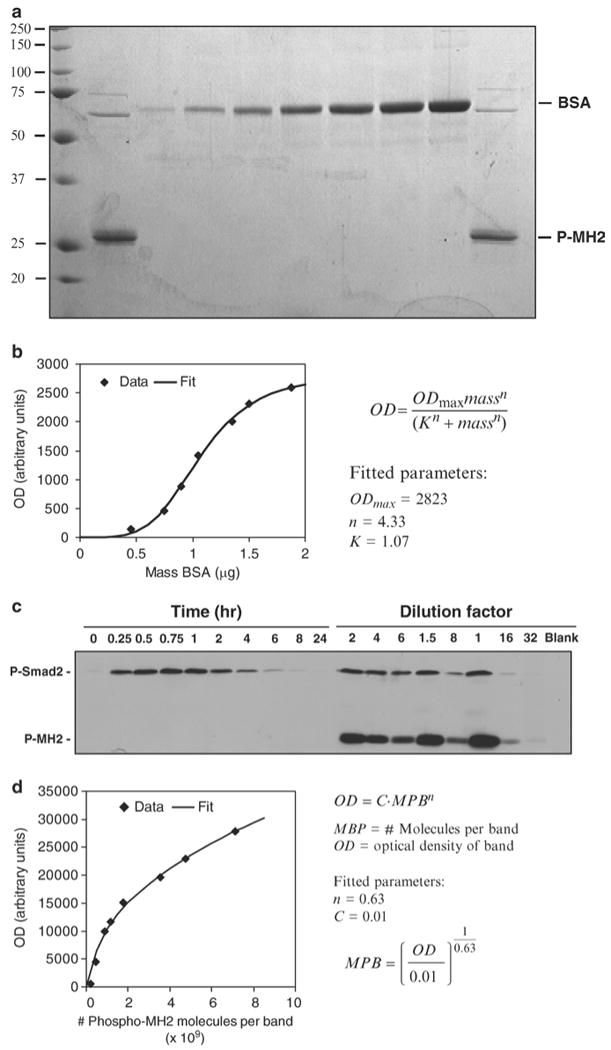
Fig. 2.

Quantification of phospho-Smad2 levels in whole cell lysates of PE25 cells exposed to 10 pM TGF-β over 8 h. (a) Quantification of the phospho-MH2 standards using Coomassie-staining.Two replicates of the phospho-MH2 (P-MH2) polypeptide were separated by SDS-PAGE alongside BSA standards (15 μL each of 0.03, 0.05, 0.06, 0.07, 0.09, 0.1, and 0.125 μg/μL serially diluted concentrations were loaded). The gel was then Coomassie-stained and quantified by densitometry. (b) A three-parameter logistic equation was used to fit the standard curve. Protein abundance per band of the phospho-MH2 peptides were numerically interpolated. The concentration of the standard was obtained by dividing the mass per band by the loading volume (15 μL). (c) Raw immunoblot data of a time series of lysates from cells treated with 10 pM TGF-β loaded alongside serial dilutions of cell lysate spiked with a known abundance of phospho-MH2 (P-MH2) polypeptide. An antibody specific to C-terminally phosphorylated Smad2 (P-Smad2) was used to probe the membrane. (d) Quantification of the immunoblot data. Phospho-MH2 band optical densities (OD) were quantified by densitometry and plotted versus the number of phospho-MH2 molecules per band. The data were fit to a power law equation in accordance with the chemiluminescence signal following the Beer-Lambert law (3). The fitted power law equation was used to calculate the estimated number of phospho-Smad2 molecules in the bands from the cell lysates. The number of molecules per cell was estimated by dividing the number of molecules per band by the estimated number of cells in the volume of lysate loaded on the gel. (1.5 × 10⁶ cells were seeded in each well and, at the end of the experiment, were lysed in 200 μL of lysis buffer, giving a ratio of approximately 7.5 × 10³cells/μL of lysate.) Specific loading volumes for each sample were determined to achieve equal total protein abundance across samples. From this type of experiment, we derived estimates for phospho-Smad2 molecules per cell over time in response to 10 pM TGF-β (15).
