
Figure 5.
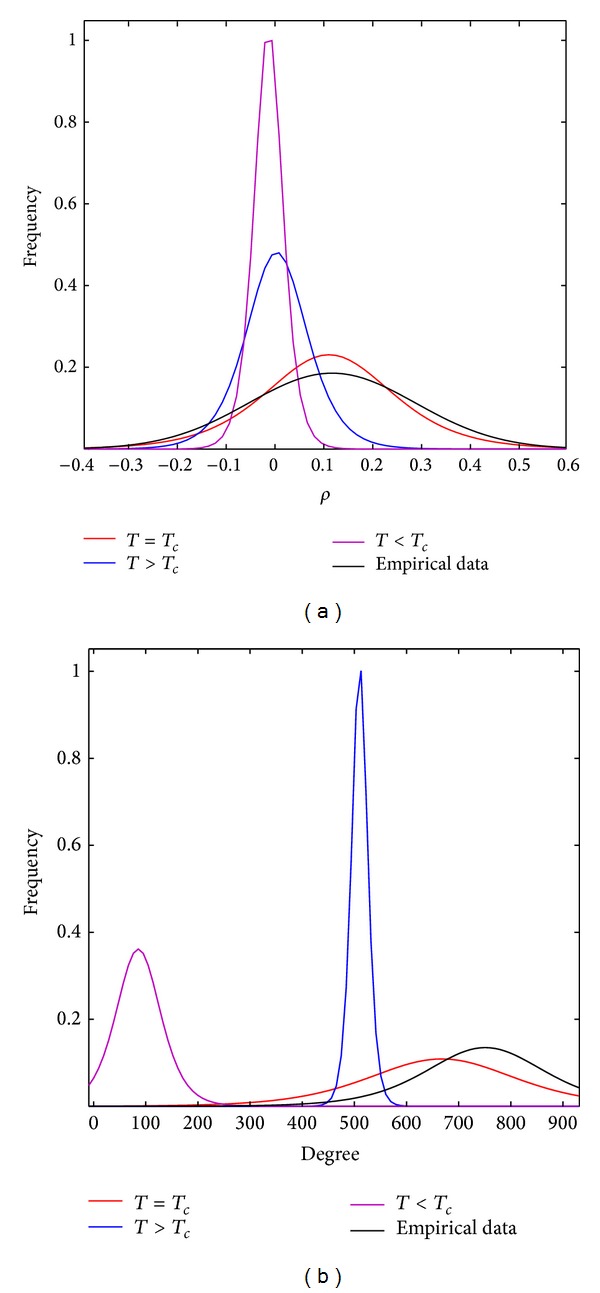
(a) shows the correlation values (ρ) distribution for three different simulations of the 2D Ising model at T < T c, T = T c, and T > T c together with the empirical data from resting state fMRI. (b) shows the degree distribution of the graphs obtained from the corresponding correlation matrices after setting a threshold equal to zero.