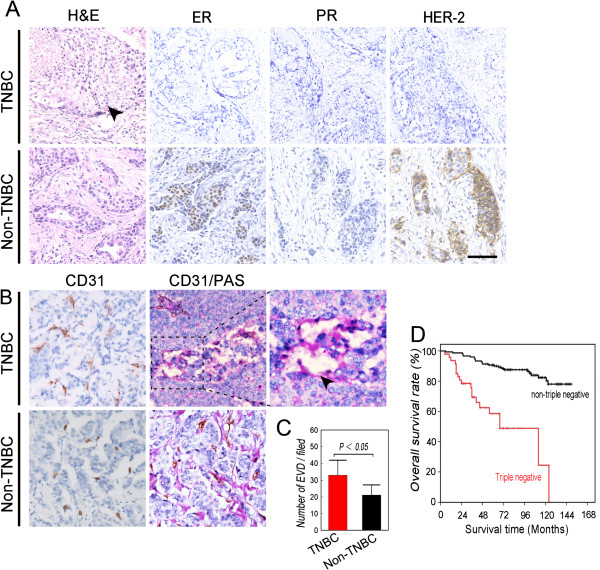
Figure 1.

Characterization of the TNBC and non-TNBC groups. Patients were diagnosed with TNBC or non-TNBC using immunohistochemical criteria and group accordingly (see Methods section). A) H&E staining and IHC analysis of ER, PR, and HER2 expression in tumor sections. Tumor nests comprised poorly differentiated highly mitotic small tumor cells in patients with TNBC, and necrosis was present in the center of the tumor nests (indicated by the black arrow). B) IHC analysis of CD31 expression indicates endothelium-dependent vessels (EDV) in sections from patients with TNBC and non-TNBC. CD31/PAS double-staining shows more VM channels in TNBC sections. The arrow indicates a VM channel formed by PAS-positive matrix and tumor cells in a TNBC section. C) Comparison of the density of EDVs between groups. D) Overall survival of patients with TNBC and non-TNBC. Kaplan–Meier analysis indicates that the prognosis of the TNBC group was poorer (χ 2 = 7.587, P = 0.006). Scale bar = 100 μm. The error bar indicates the standard deviation (SD).
