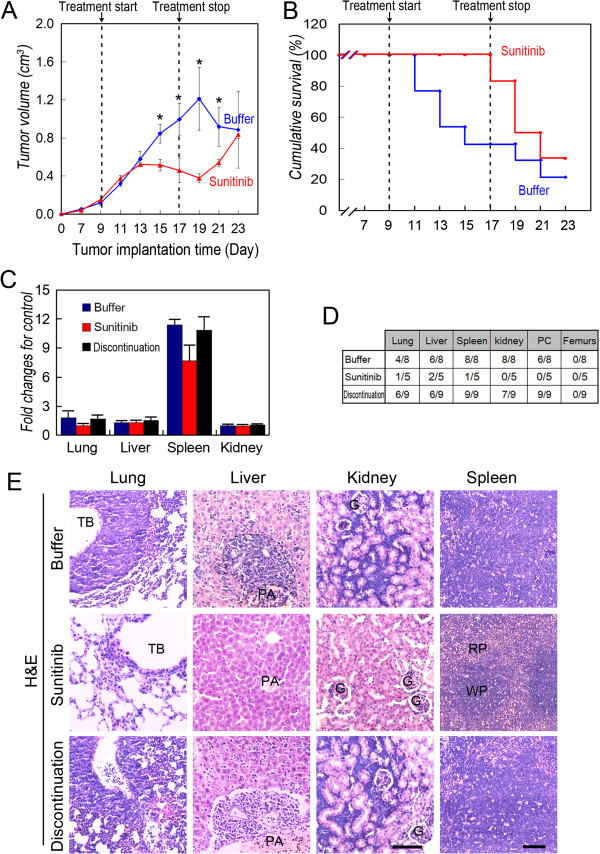
Figure 2.

Effect of sunitinib on the survival, growth, and metastasis of TA2 mice with TNBC. A) Tumor growth curve of sunitinib- and placebo-treated groups (N = 20 per group). B) Survival of groups treated with sunitinib or placebo. C) Analysis of the weights of lungs, liver, spleen, and kidneys. D) Percentage of mice with metastases in different organs. More metastatic sites were identified in the lungs, liver, spleen, kidneys, and peritoneal cavity of the mice in the control group, and the number of metastases increased when treatment was terminated. E) Morphology of metastatic sites in treated and control groups (H&E staining). The scale bar = 100 μm, and the error bar indicates the SD. TB: terminal bronchiole; G: glomerulus; PA: portal area; WB: white pulp; RB: red pulp.
