
Figure 1.
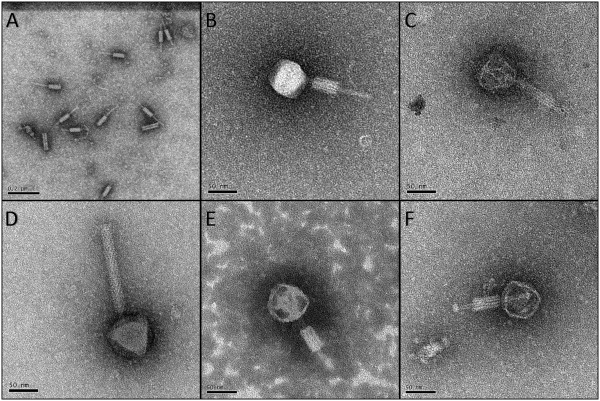
Electron micrographs of P. larvae phages. A) Tails and tail sheaths of P. larvae phages separated from the capsids (Jimmer1). These structures were more abundant than intact phages in electron micrographs. Scale bar represents 0.2 μm. B) Phage Abouo. C) Phage Davies. D) Phage Emery. E) Phage Jimmer1. F) Phage Jimmer2. Scale bars represent 50 nm for panels B-F.