
Figure 2.
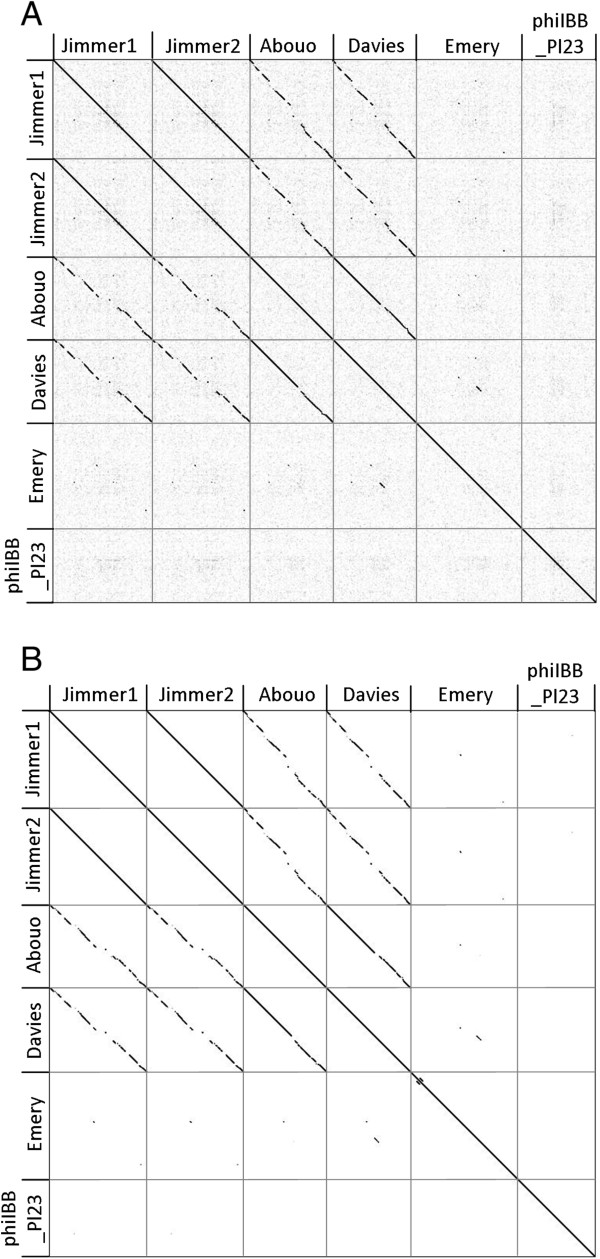
Dotplots of six P. larvae phage genomes. A) Nucleic acid comparison of full genomes. B) Amino acid comparison of coding regions in each genome.
Official websites use .gov
A
.gov website belongs to an official
government organization in the United States.
Secure .gov websites use HTTPS
A lock (
) or https:// means you've safely
connected to the .gov website. Share sensitive
information only on official, secure websites.
Dotplots of six P. larvae phage genomes. A) Nucleic acid comparison of full genomes. B) Amino acid comparison of coding regions in each genome.