
Figure 3.
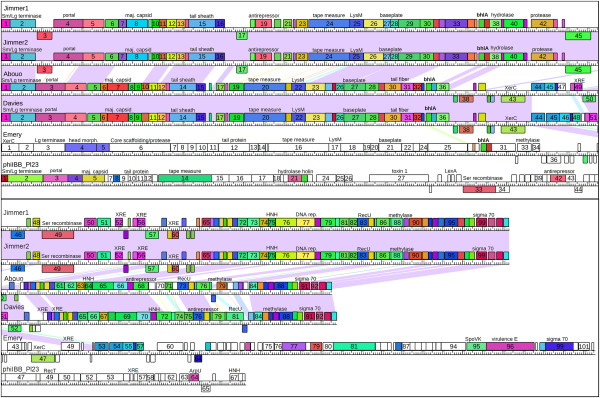
Linear genome map of the six P. larvae phages. Connecting lines between Jimmer1, Abouo, Davies, and Emery represent nucleotide similarity (E-value less than 1 × 10⁻⁴). Genes are color-coded according to phams of the encoded protein. Gene numbers are indicated inside gene boxes. Functions matching gene products described in Tables 4 and 5 are also displayed.