Figure 1.

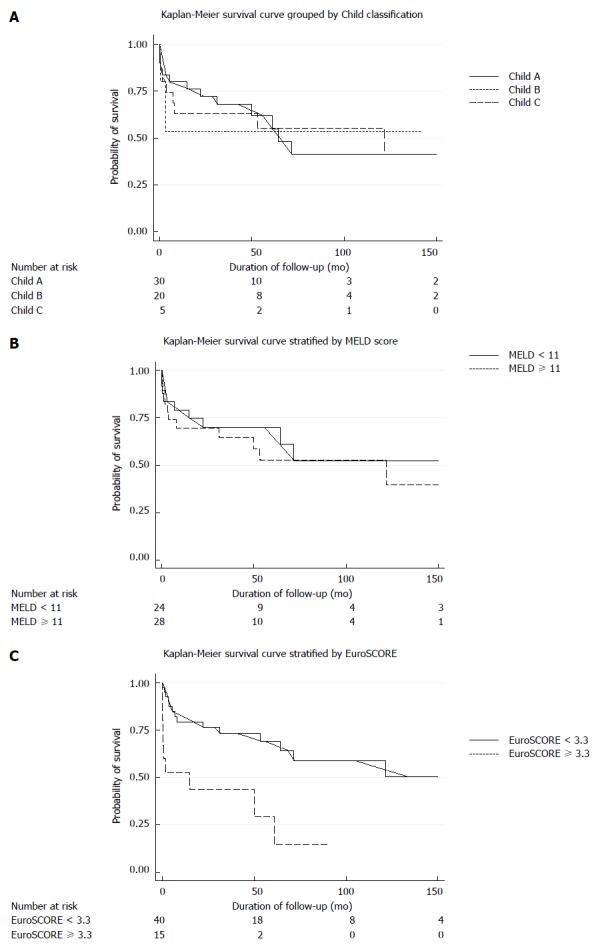
Stratified Kaplan-Meier survival curves. A: Child-Turcotte-Pugh class A, B and C; B: Model for End-Stage Liver Disease score; C: EuroSCORE. Comparison between groups by log-rank test. MELD: Model for End-Stage Liver Disease.

Stratified Kaplan-Meier survival curves. A: Child-Turcotte-Pugh class A, B and C; B: Model for End-Stage Liver Disease score; C: EuroSCORE. Comparison between groups by log-rank test. MELD: Model for End-Stage Liver Disease.