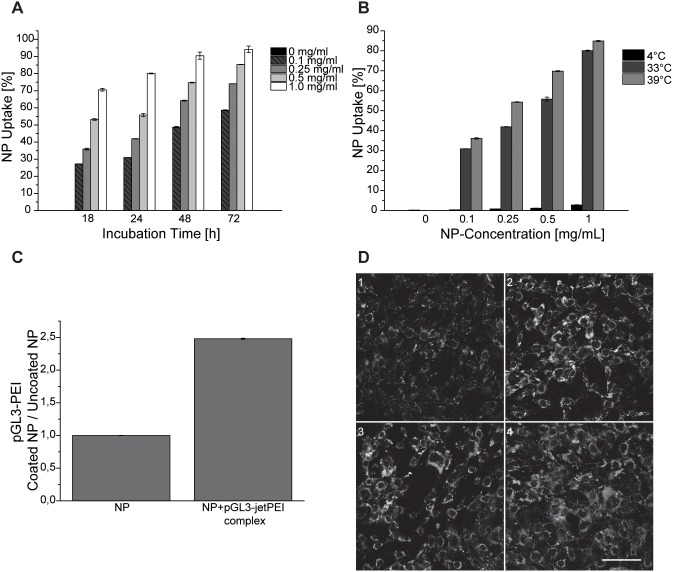
Figure 2. Uptake of HSA nanoparticles and pGL3-PEI-coated HSA nanoparticles in cerebellar granule cells.
A: Flow cytometry was used to determine the autofluorescence of the HSA nanoparticles in Cb cells. Nanoparticle uptake into the cells increased with higher concentrations of used nanoparticles (0.1 mg/ml to 1.0 mg/ml) and with incubation time (18 h to 72 h). B: Temperature dependency of nanoparticles uptake at 4°C, 33°C and 39°C. C: Comparison between unmodified and pGL3-PEI-coated HSA nanoparticle uptake in Cb cells. Results are shown as mean ± S.E.M. (n = 3). D: Confocal microscopy images represent the uptake of nanoparticles in Cb cells at different concentrations. 0.1 mg/ml (1), 0.25 mg/ml (2), 0.5 mg/ml (3), 1 mg/ml (4). Scale bar 100 µm.

