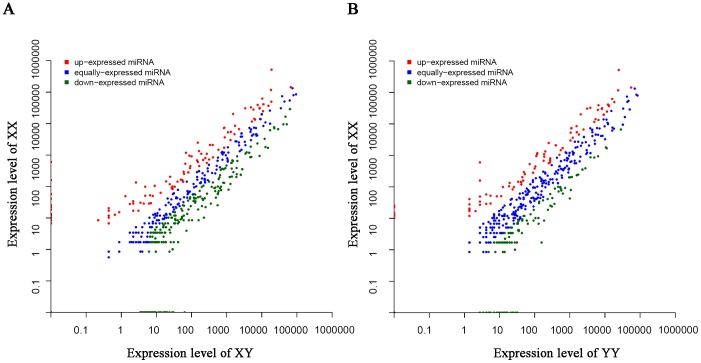
Figure 3. Difference of miRNA expression between ovary and testis.
(A) Scatter plot of miRNA expression levels in XX ovary and XY testis. (B) Scatter plot of miRNA expression levels in XX ovary and YY testis. Each point represents a miRNA. The X and Y axes show the normalized expression (NE) of miRNAs in each gonad tissue.

