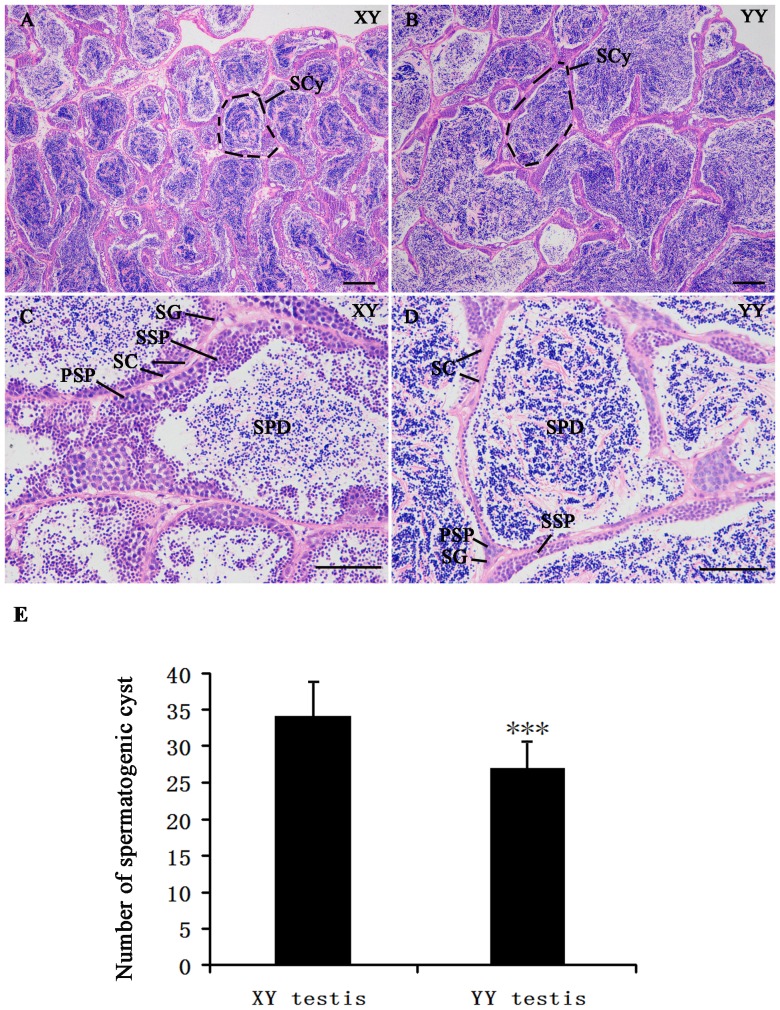
Figure 5. Histological section analysis of testis structure in yellow catfish with hematoxylin and eosin staining.
(A–D) A and C—XY testis. B and D—YY testis. Scale bars: 200 µm (A and B), 100 µm (C and D). SC: sertoli cells, PSP: primary spermatocyte, SSP: second spermatocyte, SCy: spermatogenic cyst, SPD: spermatid, SG: spermatogonia. (E) Quantification of spematogenic cyst in XY testis and YY testis. The data represents number of spematogenic cyst in each figure at 200 µm scale bar (39 pictures for each tissue from three individuals). ***p<0.001.

