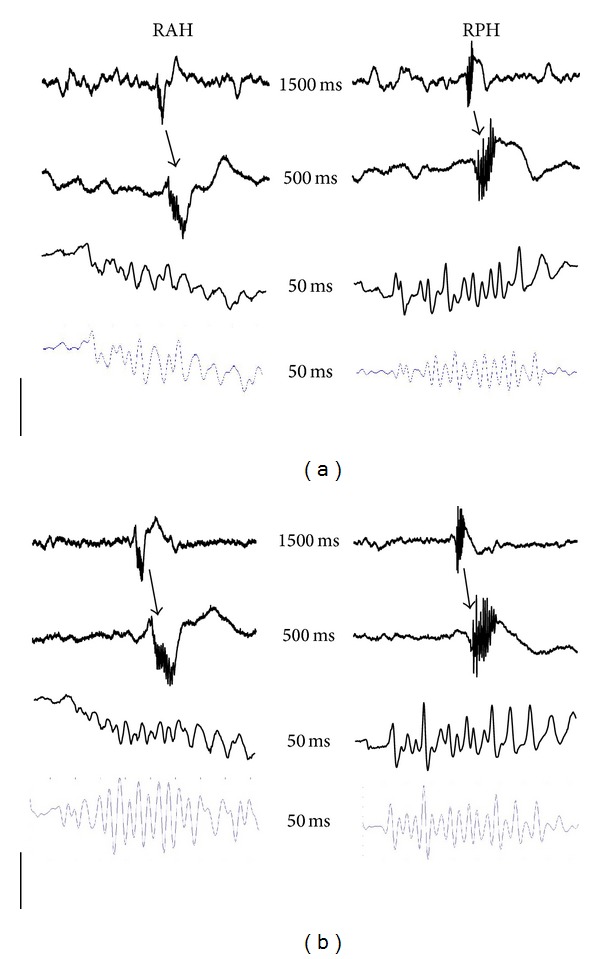
Figure 2.

Representative intracranial EEG recordings taken before drug administration from the different brain regions studied in two rats from the experimental groups (n = 6 each one) with CBX (a) and quinine (b), in which spontaneous fast ripples (FRs) were observed simultaneously: right anterior hippocampus (RAH) and right posterior hippocampus (RPH). An EEG trace of 1.5 s with a spontaneous FR (arrow in the first trace) followed by extended EEG traces of the same activity. The last EEG trace is with an 80 Hz filter. The numbers in the centre correspond to the time of each EEG trace and the y-axis calibration bar corresponds to the amplitude: 1 mV for the first and 0.4 mV for the rest of the EEG traces.
