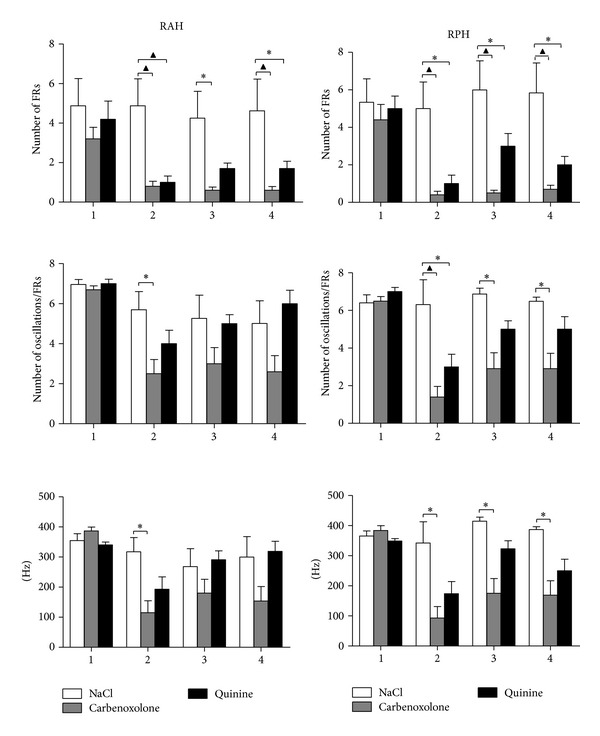
Figure 4.

Graphs show the mean number of spontaneous FR events (spontaneous FRs ± SEM) and the oscillation cycles per spontaneous FR, as well as the mean frequency (Hz), before (1), during (2), and at different times after NaCl (NaCl, 0.9%), CBX (50 nmoles), and quinine (35 pmoles) administration (3, 30–45 min; 4, 150–165 min) in the regions studied: right anterior hippocampus (RAH) and right posterior hippocampus (RPH). A significant decrease in FR number was provoked by CBX and quinine administration in the RAH and RPH (*P < 0.05; ▲ P < 0.001).
