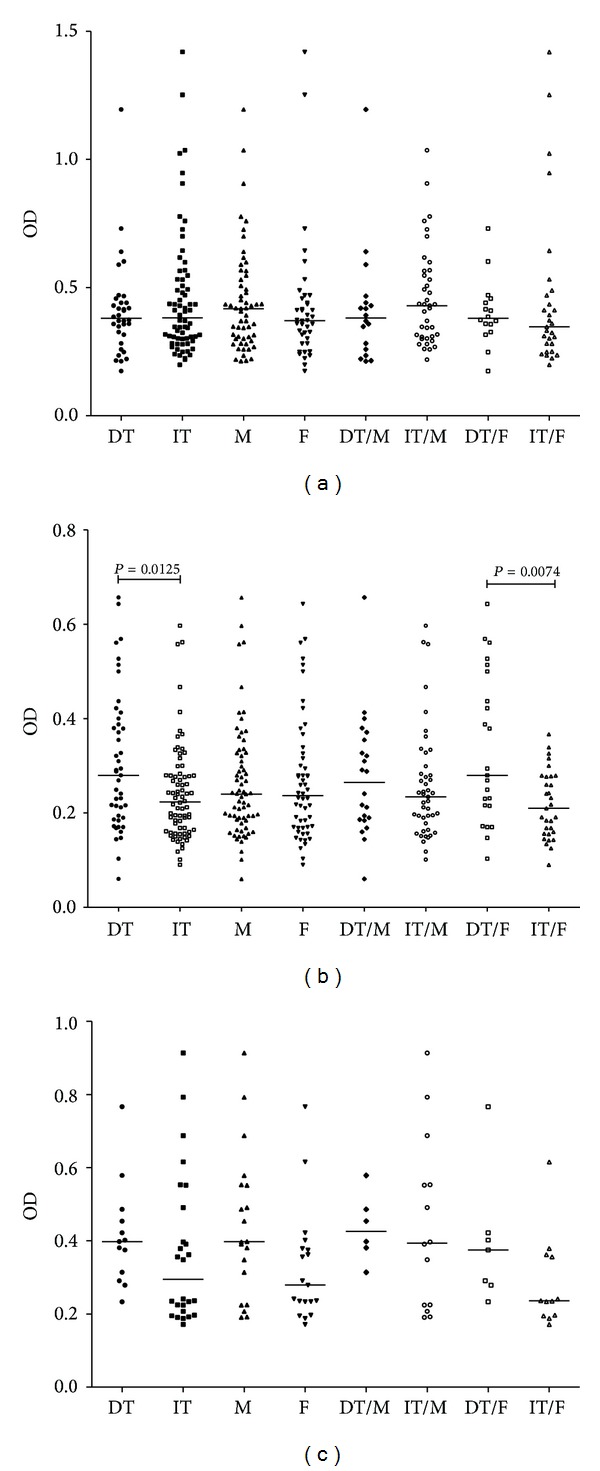
Figure 2.

The TF-specific antibody level in cancer patients by gender and tumor morphology. Each dot represents one individual and group median is indicated by horizontal lines: (a) anti-TF IgG; (b) anti-TF IgM; (c) anti-TF IgA. Tumor morphology was evaluated by the Lauren classification as an intestinal (IT) or diffuse (DT) type of tumor growth. M: males; F: females. Pvalues are shown for significant differences.
