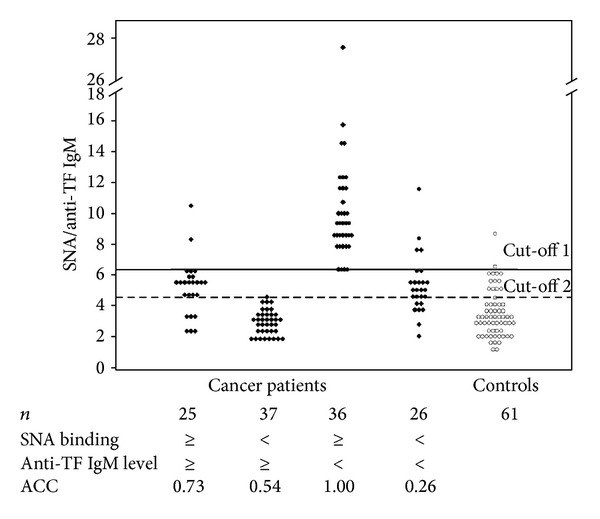
Figure 5.

The accuracy of gastric cancer diagnostics (ACC) after the stratification of gastric cancer patients by SNA binding and anti-TF IgM level. The median of the SNA binding and anti-TF IgM level was used to distinguish four subgroups as shown in Figure 5. A solid horizontal line shows the SNA/anti-TF IgM index cut-off 1 (6.1) that allows the best discrimination between subgroup 3 (SNA ≥ IgM <) and controls as determined by the ROC curves analysis. Cut-off 2 (a dotted line) indicates the best discrimination between the combined group of cancer patients and controls. ACC: accuracy of diagnostics as calculated by the ROC curve analysis.
