
Figure 2.
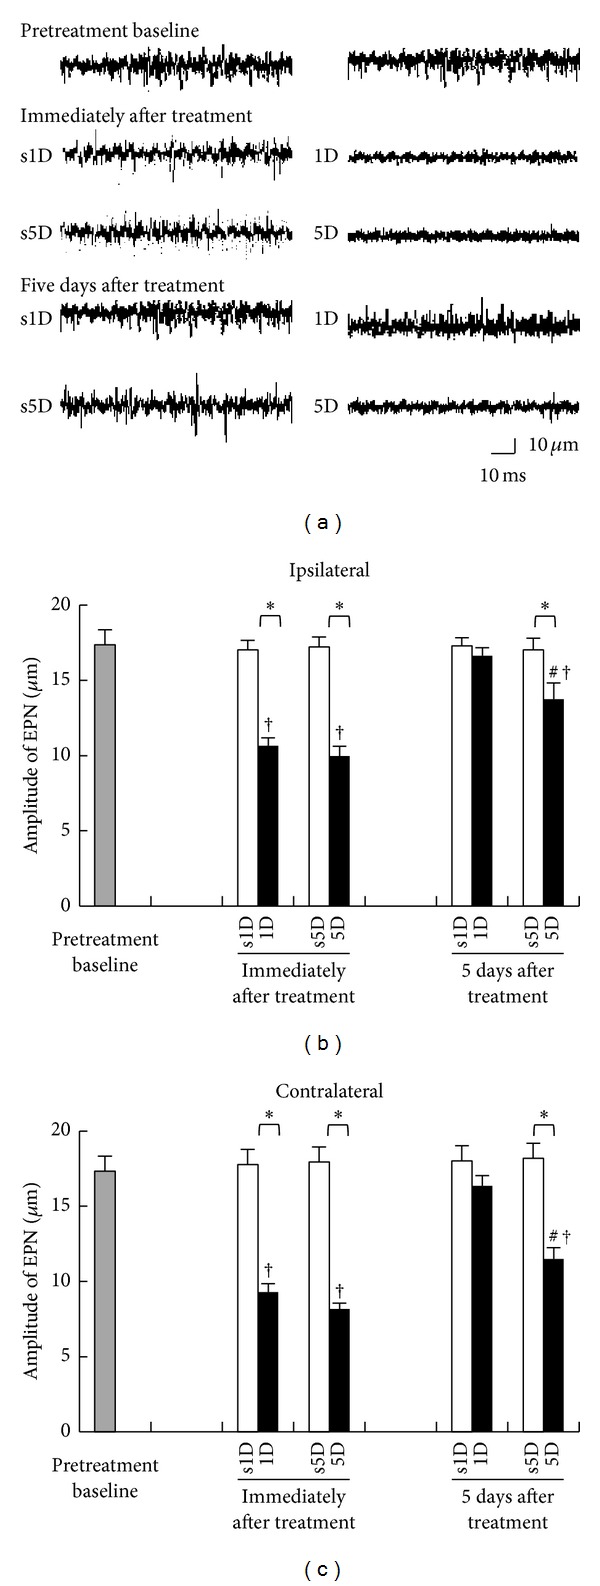
Changes in EPN amplitude measured at MTrS of biceps femoris before, immediately, and 5 days after one-(1D) and five-dosage (5D) of dry needling at gastrocnemius in experimental (1D and 5D groups) and sham-operated groups (s1D and s5D groups). Sample EPN recordings (a) in rabbits from 1D, s1D, 5D, and s5D groups. (b) Quantification of EPN amplitude in biceps femoris ipsilateral (b) and contralateral (c) to dry needling side expressed as mean ± SD. ∗ represents significant difference (P < .05) compared with sham-operated groups (s1D and s5D). # represents significant difference (P < .05) between 1D and 5D groups. †: P < .05 represent significant differences compared with pretreatment values.