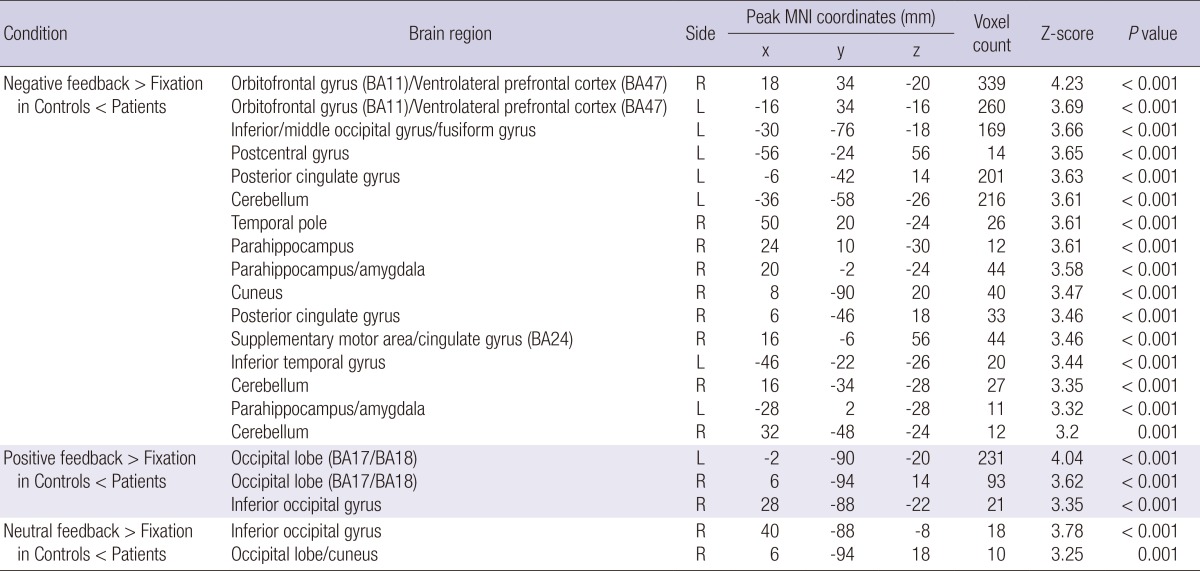
Table 5.
Comparison of activated brain areas in response to interpersonal feedbacks between the peer-rejection group and the control group controlled for baseline depression and anxiety scores (height threshold T = 3.69, uncorrected P < 0.001, extended threshold k = 10)

L, left hemisphere; R, right hemisphere; BA, Brodmann's Area. The x, y, and z coordinates are in the Montreal Neurological Institute (MNI) coordinates.
