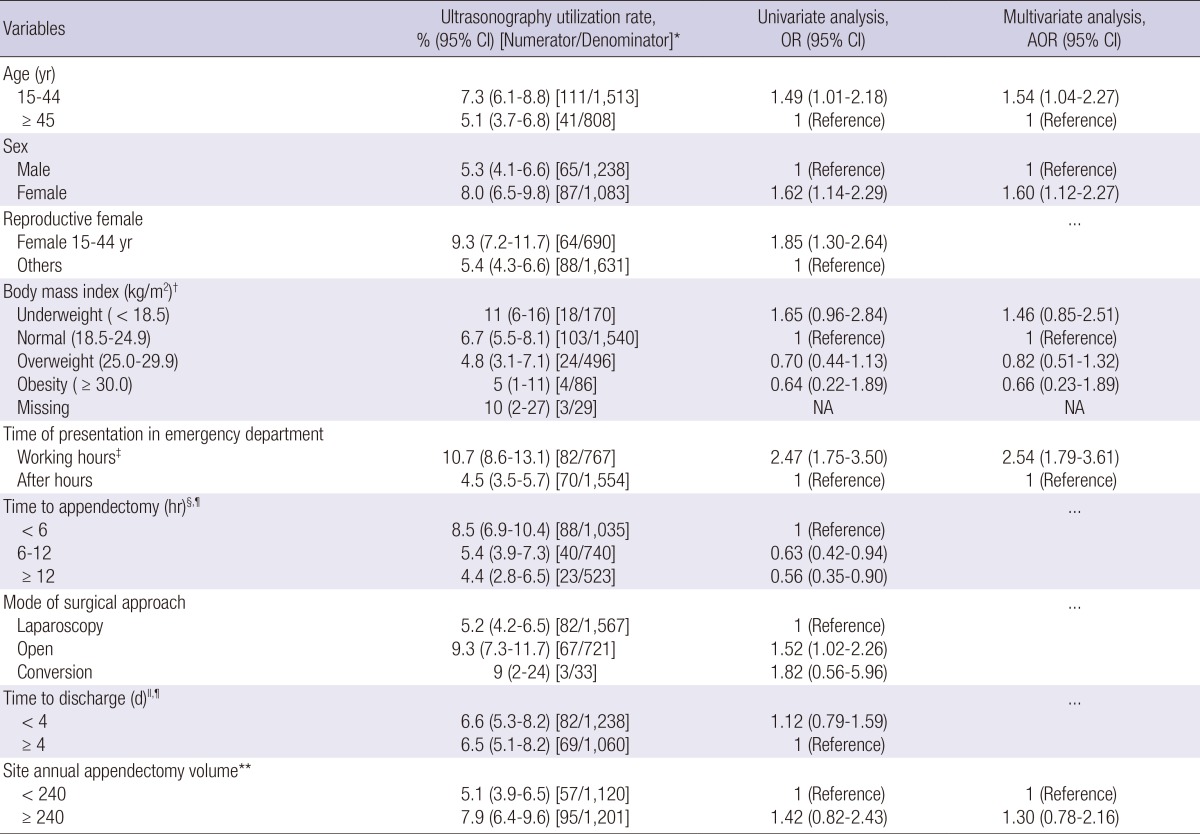
Table 3.
Subgroup analysis for the ultrasonography utilization rate

Numerators do not include three patients who underwent both CT and ultrasonography where the order of imaging was unclear. Ellipsis indicates that the variable was not tested in the multivariable analysis. *Defined as the percentage of ultrasonography utilization for an initial imaging test of all non-incidental appendectomies; †Weight in kilograms divided by the square of the height in meters; ‡8:00 AM to 5:00 PM on working days; §Defined as the interval from the emergency department visit to the induction of anesthesia for appendectomy; ∥Defined as the interval from the emergency department visit until hospital discharge; ¶Does not include 23 cases of interval appendectomy; **Number of patients included in the study. AOR, adjusted odds ratio; CI, confidence interval; NA, not applicable; OR, odds ratio.
