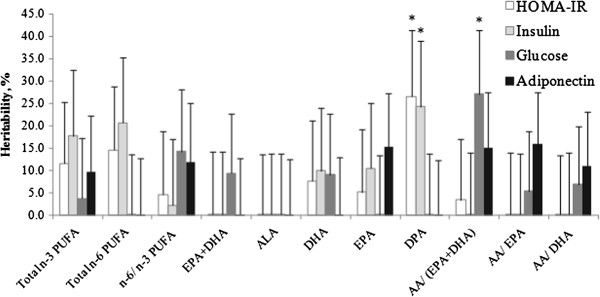
Figure 1.

GxE variance estimation of n-3 polyunsaturated fatty acids for four diabetes-related traits. The GxE variance is shown as the percentage of the total phenotypic variance of each trait (heritability). *P < 0.05 indicates significant contribution to total variance. Data are expressed as mean ± SE.
