Figure 3.

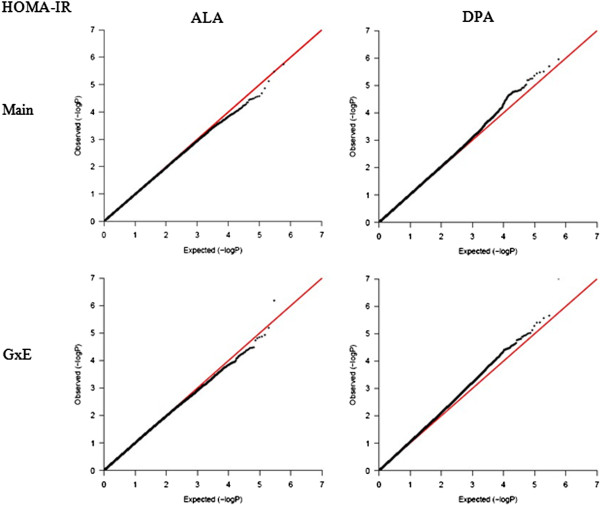
QQ-plot for HOMA-IR. Two plots on the left are for the main effect and GxE interaction of ALA (control E factor), while two plots on the right are for the DPA, which contributed a nominal significance to the GxE variance.

QQ-plot for HOMA-IR. Two plots on the left are for the main effect and GxE interaction of ALA (control E factor), while two plots on the right are for the DPA, which contributed a nominal significance to the GxE variance.