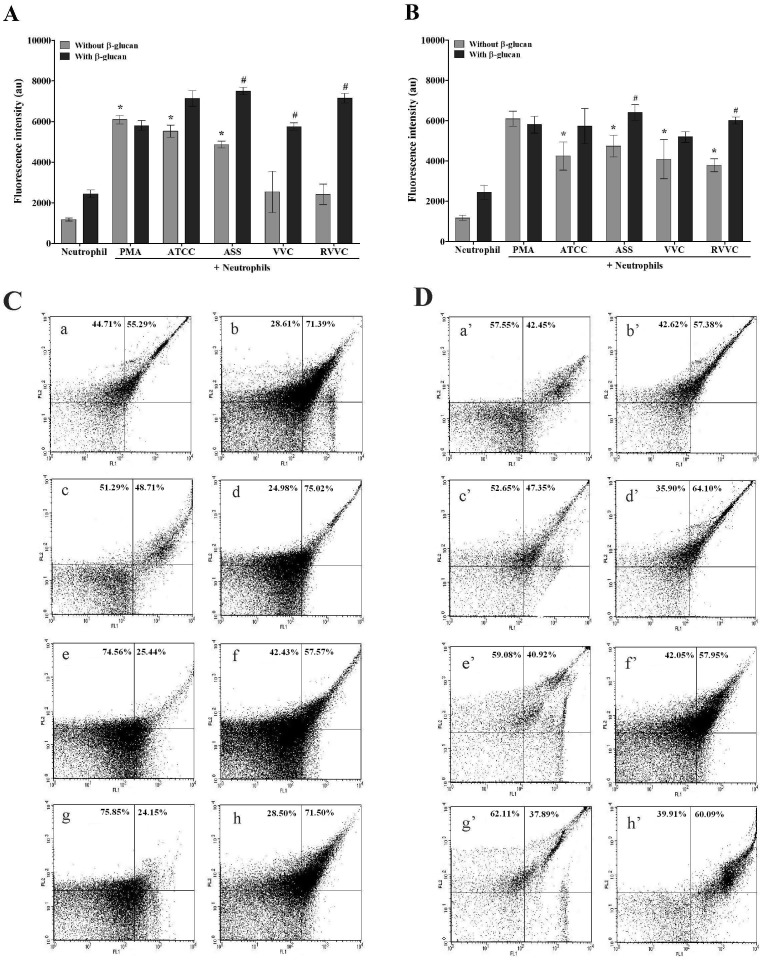
Figure 3. Intracellular oxidant species production by β-glucan-treated neutrophils activated by different isolates of C. albicans and C. glabrata determined by flow cytometry.
Neutrophils (2.0×10⁶ cells/ml) were previously treated or not with 3 mg/ml β-glucan and incubated for 1 h with the reference strain and different isolates of (A) C. albicans and (B) C. glabrata (RVVC, VVC, and ASS; 2.0×10⁷ CFU/ml), followed by 30 min incubation with DHR. The data are expressed as the mean ± SD of at least three independent experiments. * p≤0.05, significant difference compared with the control group (neutrophils alone); # p≤0.05, significant difference compared with untreated and activated neutrophils. (C and D) Representative dot plot display of FL1 (green fluorescence) vs. FL2 on a logarithmic scale. (C – (a) ATCC, (c) ASS, (e) VVC,(g) RVVC) C. albicans with untreated neutrophils. (C – (b) ATCC,(d) ASS,(f) VVC,(h) RVVC) C. albicans with neutrophils previously treated with 3 mg/ml β-glucan. (D – (a’) ATCC,(c’) ASS,(e’) VVC,(g’) RVVC) C. glabrata with untreated neutrophils. (D – (b’) ATCC,(d’) ASS,(f’) VVC,(h’) RVVC) C. glabrata with neutrophils previously treated with 3 mg/ml β-glucan.

