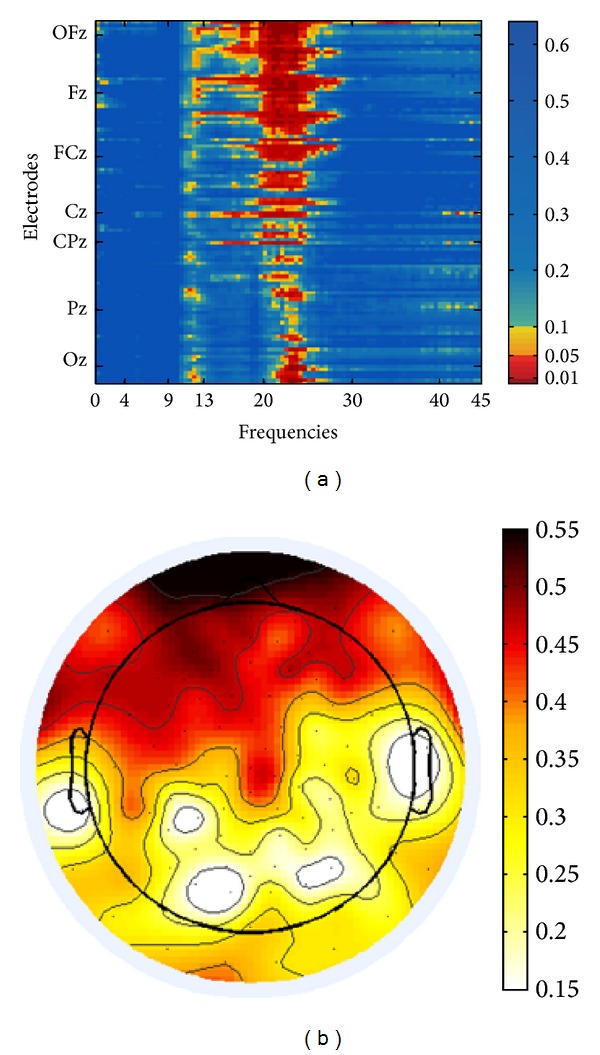
Figure 3.

(a) Nonnormalized EEG spectral power adjacency matrix of Pearson product-moment correlations with tinnitus distress. Significance levels (P values) of the correlations are color-coded (one-sided, uncorrected for multiple comparisons). On the y-axis electrodes are aligned from rostral (top) to caudal (bottom), irrespective of laterality. Positions of electrodes on the central line are marked. (b) Topographic plot of EEG power correlations in the upper β-band (20–25 Hz) with tinnitus distress and strength of correlations (Pearson's r) are color-coded.
