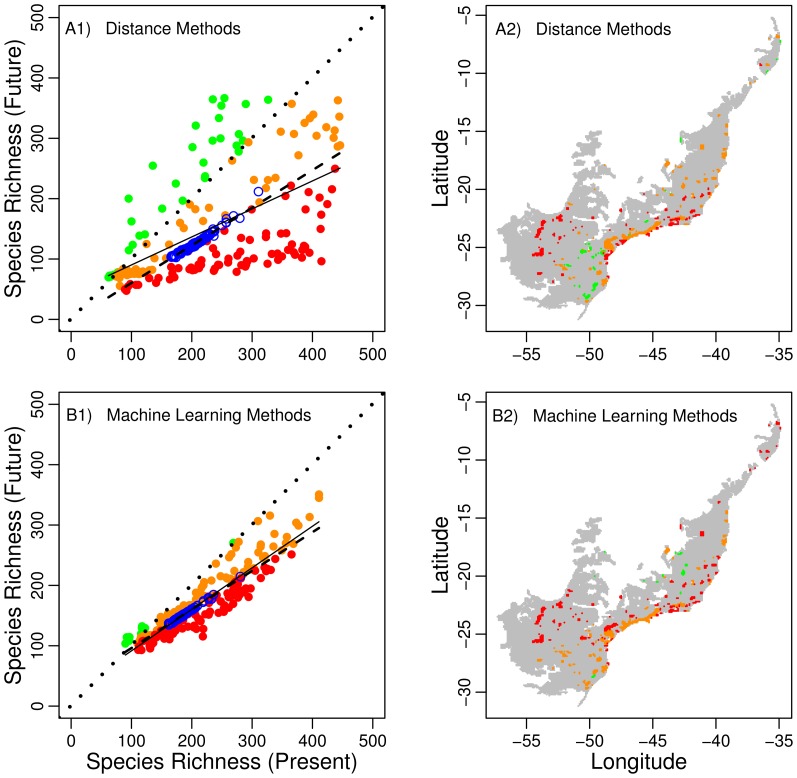
Figure 6. Relationship between present and future tiger moth species richness in the Atlantic Forest Biodiversity Hotspot, Brazil.
Modeled present and future species richness of protected areas (filled circles) in the Atlantic Forest biome (A1 and B1). Open blue circles indicate expected species richness according to a null model of random location of protected areas in the biome. Dashed lines are the extrapolated regressions of the expected species richness according to the null model (A1: y∼−1.983+0.623*x; B1: y ∼32.178+0.640*x). Filled red circles indicate protected areas predicted to have severe species richness losses, defined as those in which future species richness will be lower than the predicted by a null model of random location of protected areas (below dashed regression line). Orange filled circles indicate protected areas predicted to have mild species richness losses, defined as those in which future species richness will be higher than the predicted by a null model of random location of protected areas. Green filled circles indicate protected areas predicted to gain species richness. Solid lines indicates the regression of modeled species richness in the future against modeled species richness in the present (A1: y∼43.817+0.464*x, R2 = 0.362, F1,185 = 105.2, P<0.001; B1: y∼22.736+0.688*x, R2 = 0.850, F1,185 = 1051.0, P<0.001). Maps of protected areas predicted to gain (green) or lose (orange, red) species in future changing climate (A2 and B2).

