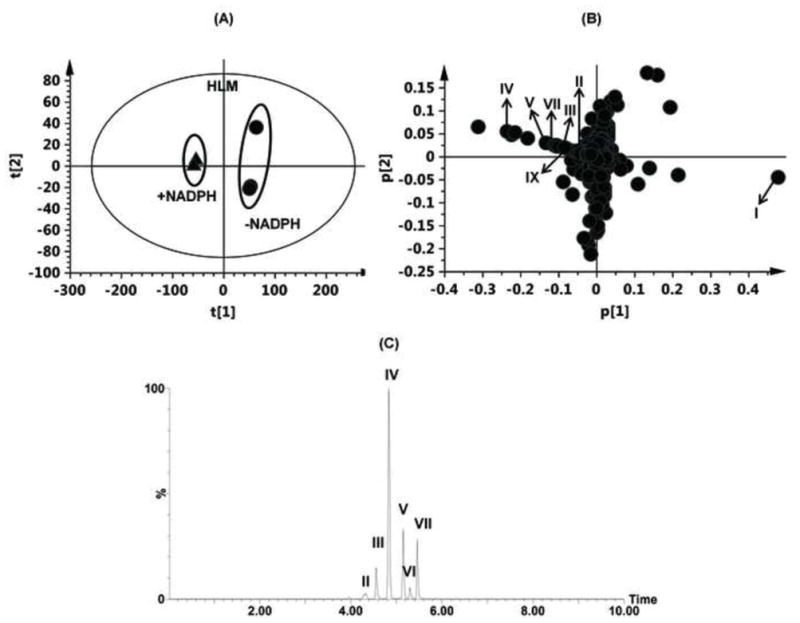
Figure 4.

Identification of metabolites in HLM incubation system. (A) Scores plot of a PCA model from HLM incubation mixture with and without NADPH. (B) PCA loading scatter plot; PZQ and its phase I metabolites are labelled in the plot (I, II, III, IV, V, VII and IX). The p(corr)[1] values represent the interclass difference, and the p[1] values represent the relevant abundance of ions. (C) Representative chromatogram of the six mono-oxidized metabolites.
