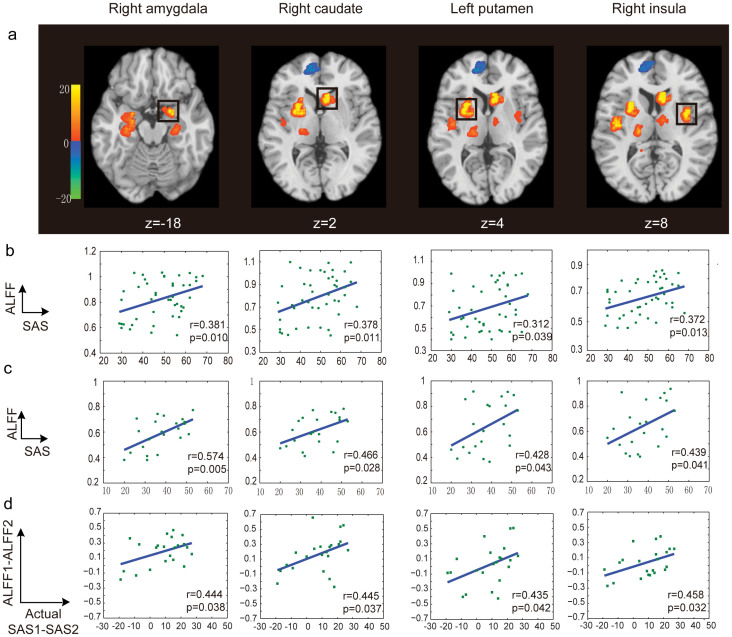
Figure 3. The distribution of the most informative voxels in the SAS prediction.
(a) The SVR weight map: the color intensities indicate the signed SVR weights. Brain areas showed significant correlations between the ALFF features and SAS are indicated by rectangles. There are significant positive correlations between the ALFF features and SAS at Time 1 (b) and Time 2 (c) for each indicated brain area. And there are also significant positive correlations of the changes of ALFF and the alterations of the actual symptom severity of SAS between Time 1 and Time 2 (d). Note: **p<0.01, t-test. No brain region was found, of which the ALFF features were significantly negatively correlated with SAS at Times 1 and 2.

