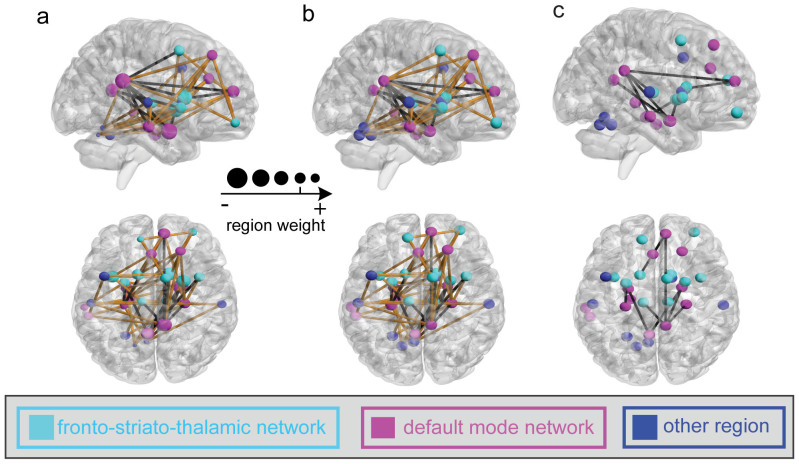
Figure 6. The distribution of the most informative FCs.
(a) and (b): for SDS prediction at Time 1 and Time 2, respectively. The line color represents the significance of the correlation between the FC values and the SDS (black: significant negative correlation with p<0.05; yellow: insignificant correlation with p>0.05; no significant positive correlation was found). (c): the FCs with significant negative correlation of the changes of FC and the alterations of the actual symptom severity of SDS between Time 1 and Time 2. Regions indicated by the nodes are colors-coded by category (cyan: fronto-striato-thalamic network; magenta: default-mode network; blue: other region); and for (a), the radius of each node is scaled with the sum of the corresponding SVR weights of all the connections to and from that region.

