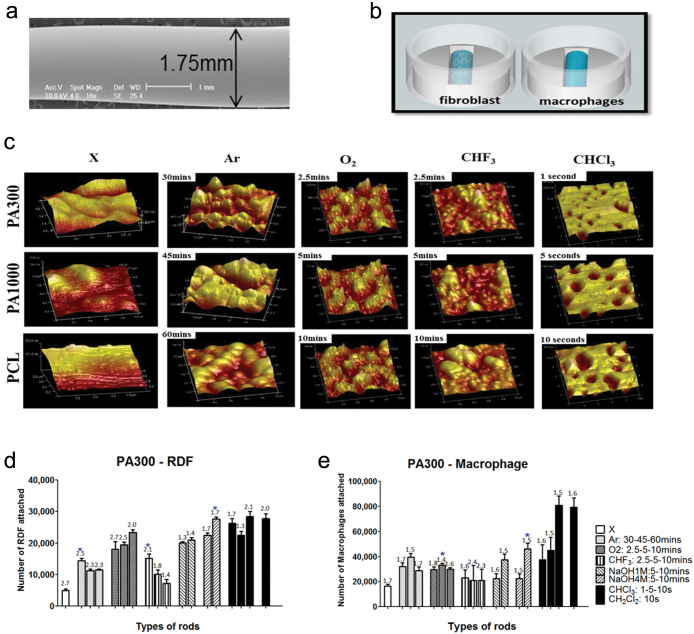
Figure 1. Pre-selection of surface treatments.
(a) SEM analysis of fabricated fiber (scale bar: 1 mm). (b) Scheme of mono-culture cell seeding on agarose mould. (c) 3D AFM images of PA300, PA1000 and PCL before and after different surface treatments and exposure time (scan size of 1 μm 2, with exception to CHCl3 at 25 μm 2). DNA assay analysis of rat dermal fibroblasts (d) and macrophages (e) on PA300 at attachment. Unmodified (X) rods were subjected to either argon plasma treatment for 30, 45, and 60 minutes (Ar30–45–60, bars from left to right), oxygen or trifluoromethane plasma treatment for 2.5, 5, 10 minutes (O 2 2.5–5–10, CHF 3 2.5–5–10, bars from left to right). Other rods were treated with wet etching using either sodium hydroxide at 1 M or 4 M concentration for 5 and 10 minutes (NaOH1M:5–10, NaOH4M:5–10, bars from left to right), chloroform or dichloromethane for 1, 5 and 10 seconds (CHCl3: 1–5–10 s, CH2Cl2–10 s, bars from left to right). The fold increase in cell number at day 3 can be seen above individual bars. RDF attachment was statistically increased in all treatments except for CHF 3 5–10 samples. Macrophage attachment increased significantly after Ar, O2 and CHCl3 treatments. Data are shown as mean ± s.d. (n = 3). Star (*, P < 0.05) indicates the best parameter for each treatment type.

