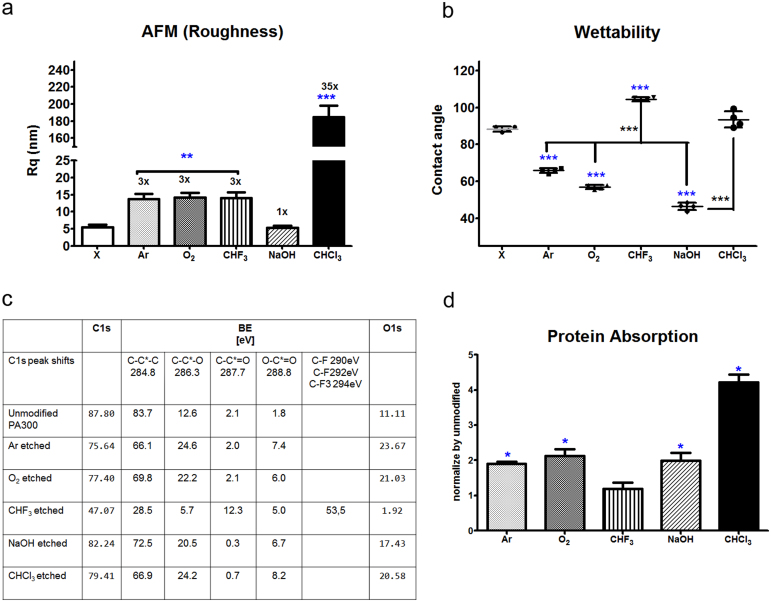
Figure 2. Material characterization of pre-selected treatments.
(a) AFM roughness quantification (Rq at scan size 1 μm). The number of folds each treated rod increase in roughness is shown above its bar. (b) Hydrophilic treatments (70–40°) consisted of Ar, O2 and NaOH, while hydrophobic treatments (85–110°) consisted of CHF 3 and CHCl3) (n = 4). (c) XPS measurement on unmodified versus pre-selected modified rods. Groups of 2-fold increase (Ar, O2, NaOH and CHCl3) and 5-fold decrease (CHF 3) in oxygen content can be seen. (d) Protein absorption assay on unmodified versus pre-selected modified rods. Protein absorption in modified rods was normalized by the protein absorption in unmodified rods, thus showing fold differences between the different treatments. All data are shown as mean ± s.d. (n = 3), if not stated otherwise. Blue stars (*P < 0.05, ** P < 0.01, *** P < 0.001) indicate statistically significant values in comparison to unmodified (X), black stars compares each treatments to one another.

