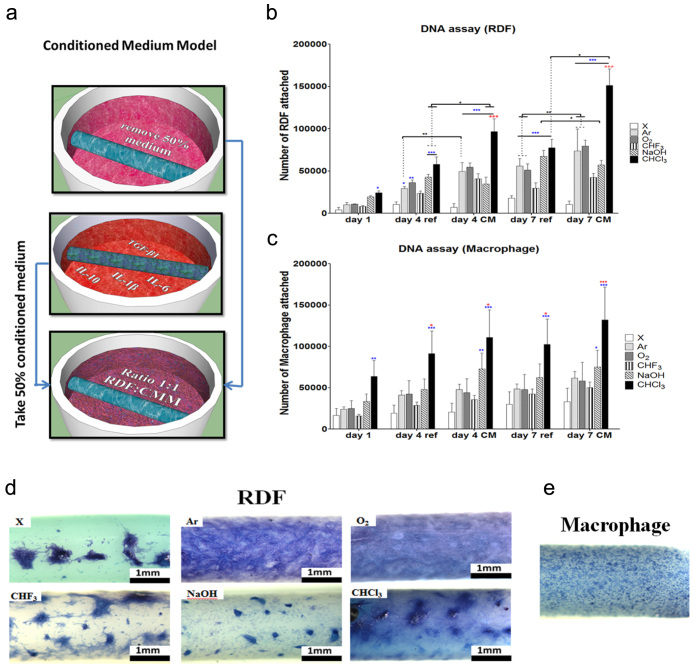
Figure 3. Conditioned medium co-culture in vitro studies on unmodified versus modified rods.
(a) Conditioned medium co-culture scheme. DNA assay on RDFs (b) and macrophage (c) seeded rods, at day 1, 4 and 7 and with (CM) or without (ref) conditioned medium (X-axis). Different surface treatment are represented by different bar patterns. RDFs attachment was statistically increased (P < 0.05) in all treatments except for CHF35-10 samples. Data are shown as mean ± s.d. (n = 3). Blue stars (*P < 0.05, ** P < 0.01, *** P < 0.001) indicate statistical significances in comparison to unmodified, red stars indicate the best parameter from all the treatment types, while black stars evaluate statistical differences between the different culture conditions. Illustration of cell distribution at day 4 of RDFs (d) and macrophages (e) via methylene blue staining (scale bar: 1 mm). RDFs illustrated above showed different distribution of cells dependent on the treatment, while in all treatments distribution of macrophages were alike.

