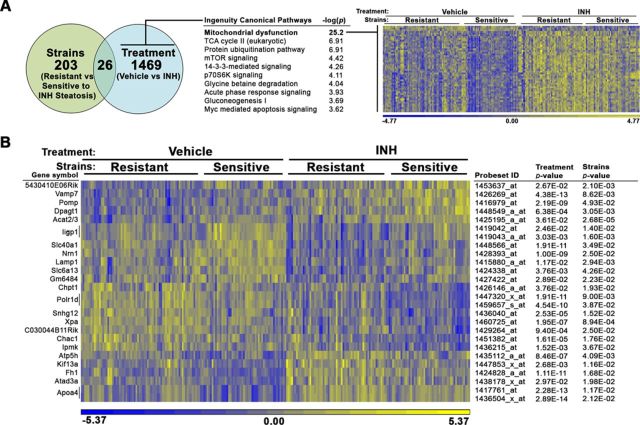
FIG. 2.
Gene expression analysis identifies mitochondrial transcript changes associated with INH treatment. mRNA expression analysis was performed in liver tissue derived from all vehicle- and INH-treated animals in the study. An ANOVA model using the fixed categorical factors strains (resistant vs sensitive to INH-induced microveiscular steatosis) and treatment (vehicle vs. INH) was then applied to the intensity data to determine which probesets were significantly altered by each experimental factor individually or in concert. (A) The number of probesets significantly altered by sensitivity to steatosis and treatment is depicted in a Venn diagram. Canonical pathways enriched among genes significantly associated with treatment (p < 0.05) but not strains (p > 0.05) were identified using the Tox Analysis feature in IPA. The top 10 pathways are represented. Relative gene expression changes in the top pathway, mitochondrial dysfunction (bold), are represented in a heat map. (B) A heat map representing relative gene expression changes the 26 probesets significantly altered by both factors: strains and treatment. The color scales for both heat maps represent the relative ratio of log2 (intensity).

