
Figure 3.
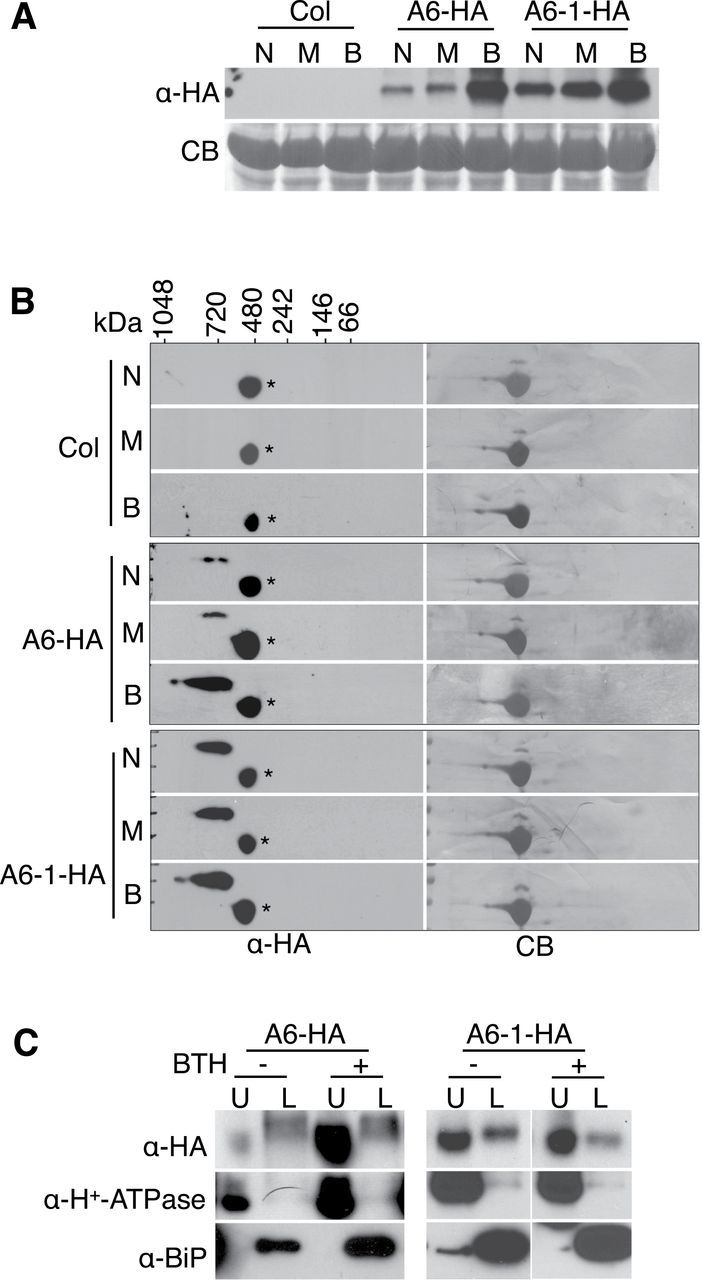
The SA Agonist BTH Causes Increases in the Levels and Sizes of ACD6 and ACD6-1 Complexes and the Fraction of Each Protein Localized to the Plasma Membrane.
Microsomal proteins from Col, ACD6-HA (A6-HA), and ACD6-1-HA (A6-1-HA) untreated leaves (N) or leaves treated for 48 h with 150 μM BTH (B) or water with 0.005% Silwet-77 (M, mock control) were separated by SDS–PAGE, 2D BNG, or SDS–PAGE following aqueous two-phase partitioning and immunoblotted with antibodies against HA, BAK1, H+–ATPase (plasma membrane marker), and/or BIP (ER marker), respectively. CB, Coomassie blue-stained membrane.
(A) ACD6-HA and ACD6-1-HA levels in microsomal membranes are increased after stimulation of the SA pathway using BTH.
(B) ACD6-HA and ACD6-1-HA microsomal membrane complexes analyzed by 2D BNG are large and increase in size after BTH treatment. *, non-specific band.
(C) The fraction of ACD6-HA at the plasma membrane (U, upper phase) versus ER-enriched membranes (L, lower phase), assayed by aqueous two-phase partitioning, increases after BTH treatment. A large amount of ACD6-1-HA is in the upper phase even without BTH treatment. These experiments were repeated three times, with similar results. For the right two panels in (C) (A6-1-HA), blots on the left (– BTH) and right (+ BTH) sides were from the same experiment, but separate membranes were simultaneously processed.