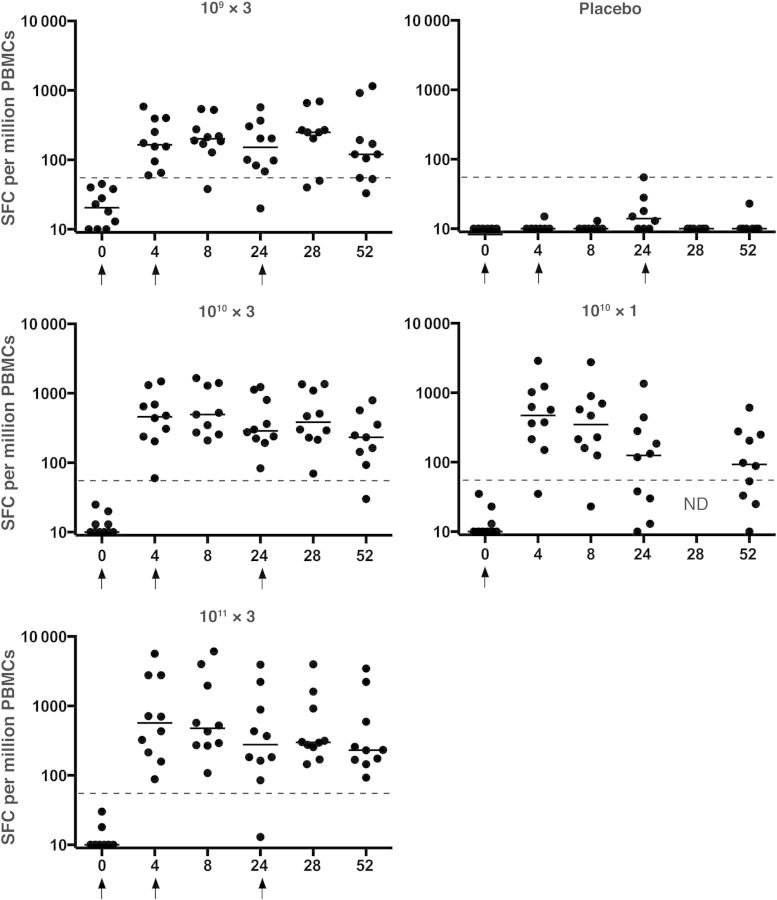
Figure 4.
EnvA enzyme-linked immunospot assay responses by group. Individual subject responses are shown by week and vaccine group. Dots indicate individual responses at a given time point; horizontal lines, median values at a given time point for the group; dashed lines, cutoff for the assay; arrows, times when vaccine or placebo was administered. Abbreviations: ND, not done; PBMCs, peripheral blood mononuclear cells; SFCs, spot-forming cells.

