
Figure 5.
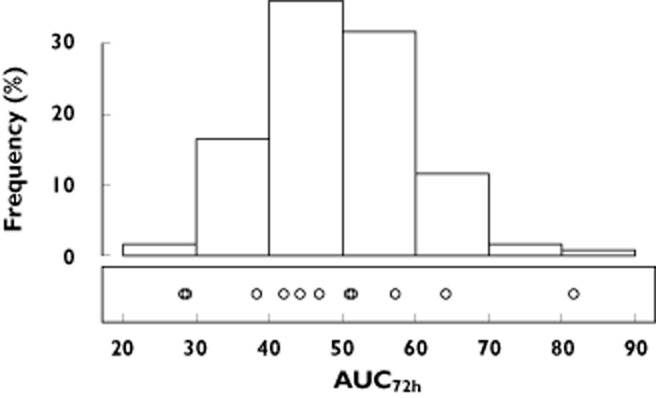
Visual predictive check comparing the distribution of the 100 model simulated AUC72h values (histogram on top) against the observed AUC72h values (open circles) after a standard 400 mg oral dose of moxifloxacin
Official websites use .gov
A
.gov website belongs to an official
government organization in the United States.
Secure .gov websites use HTTPS
A lock (
) or https:// means you've safely
connected to the .gov website. Share sensitive
information only on official, secure websites.
Visual predictive check comparing the distribution of the 100 model simulated AUC72h values (histogram on top) against the observed AUC72h values (open circles) after a standard 400 mg oral dose of moxifloxacin