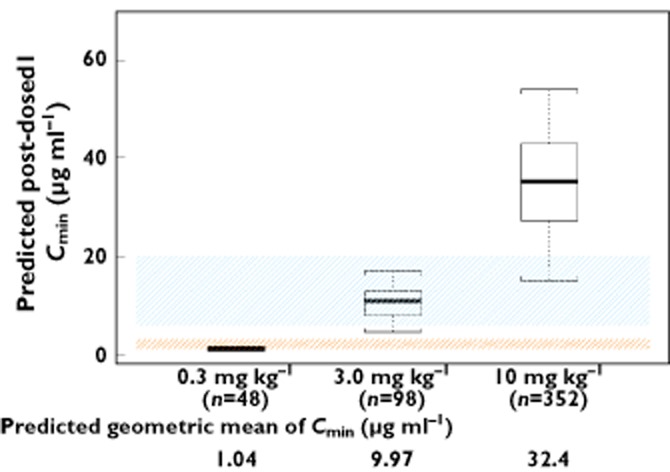
Figure 3.

Distribution of post-dose 1 trough concentrations (Cmin1) by dose. The box plots represent median (bold line), 25th, and 75th percentiles of the Cmin1 distribution. The whiskers represent 5th and 95th percentiles of the distribution. The shaded areas indicate the target trough concentration ranges that maximally inhibit the binding of CTLA-4 to B7.1 (6–20 μg ml−1) and B7.2 (1–3 μg ml−1)
