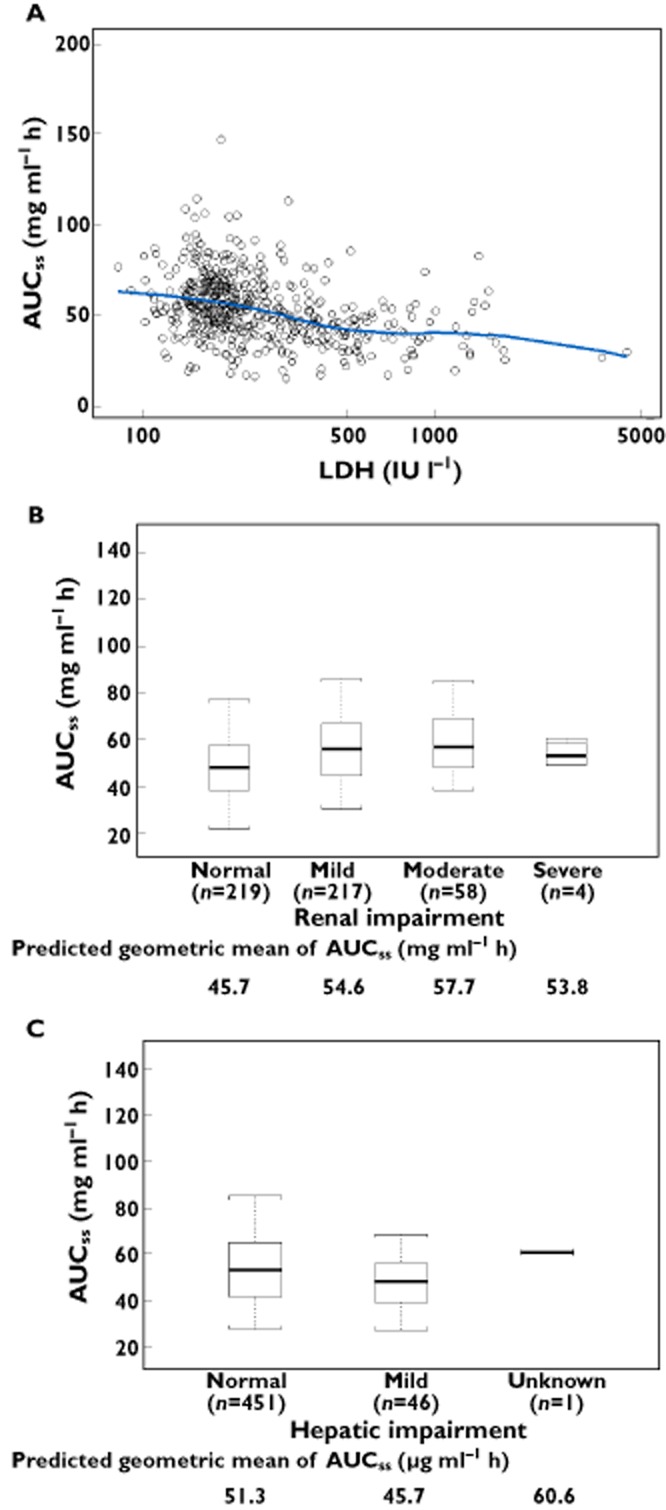
Figure 5.

Ipilimumab AUCss
vs. (A) baseline LDH levels, (B) renal function status and (C) NCI liver dysfunction group. The box plots represent median (bold line), 25th, and 75th percentiles of the AUCss distribution. The whiskers represent 5th and 95th percentiles of the distribution.  , individual estimates;
  , locally weighted smooth line
